


Your phone is probably within arm’s reach right now. If you’ve bought anything this week, there’s a good chance it happened on that screen and with your AI assistant.
Mobile shopping isn’t a trend to watch. It’s the default. From grabbing groceries before the meeting ends to booking a last-minute flight during your commute, smartphones have quietly taken over retail.
So where does that leave the numbers? Here are 30 mobile ecommerce statistics that show exactly what’s happening and where things are headed.
Top mobile eCommerce statistics worldwide
You’re sitting on your couch, scrolling through TikTok app, when something catches your eye. One tap later, it’s ordered and on its way. This isn’t just convenient—it’s how we’re all shopping now.
Let’s peek into what the numbers tell us about where we’re heading in mobile eCommerce.
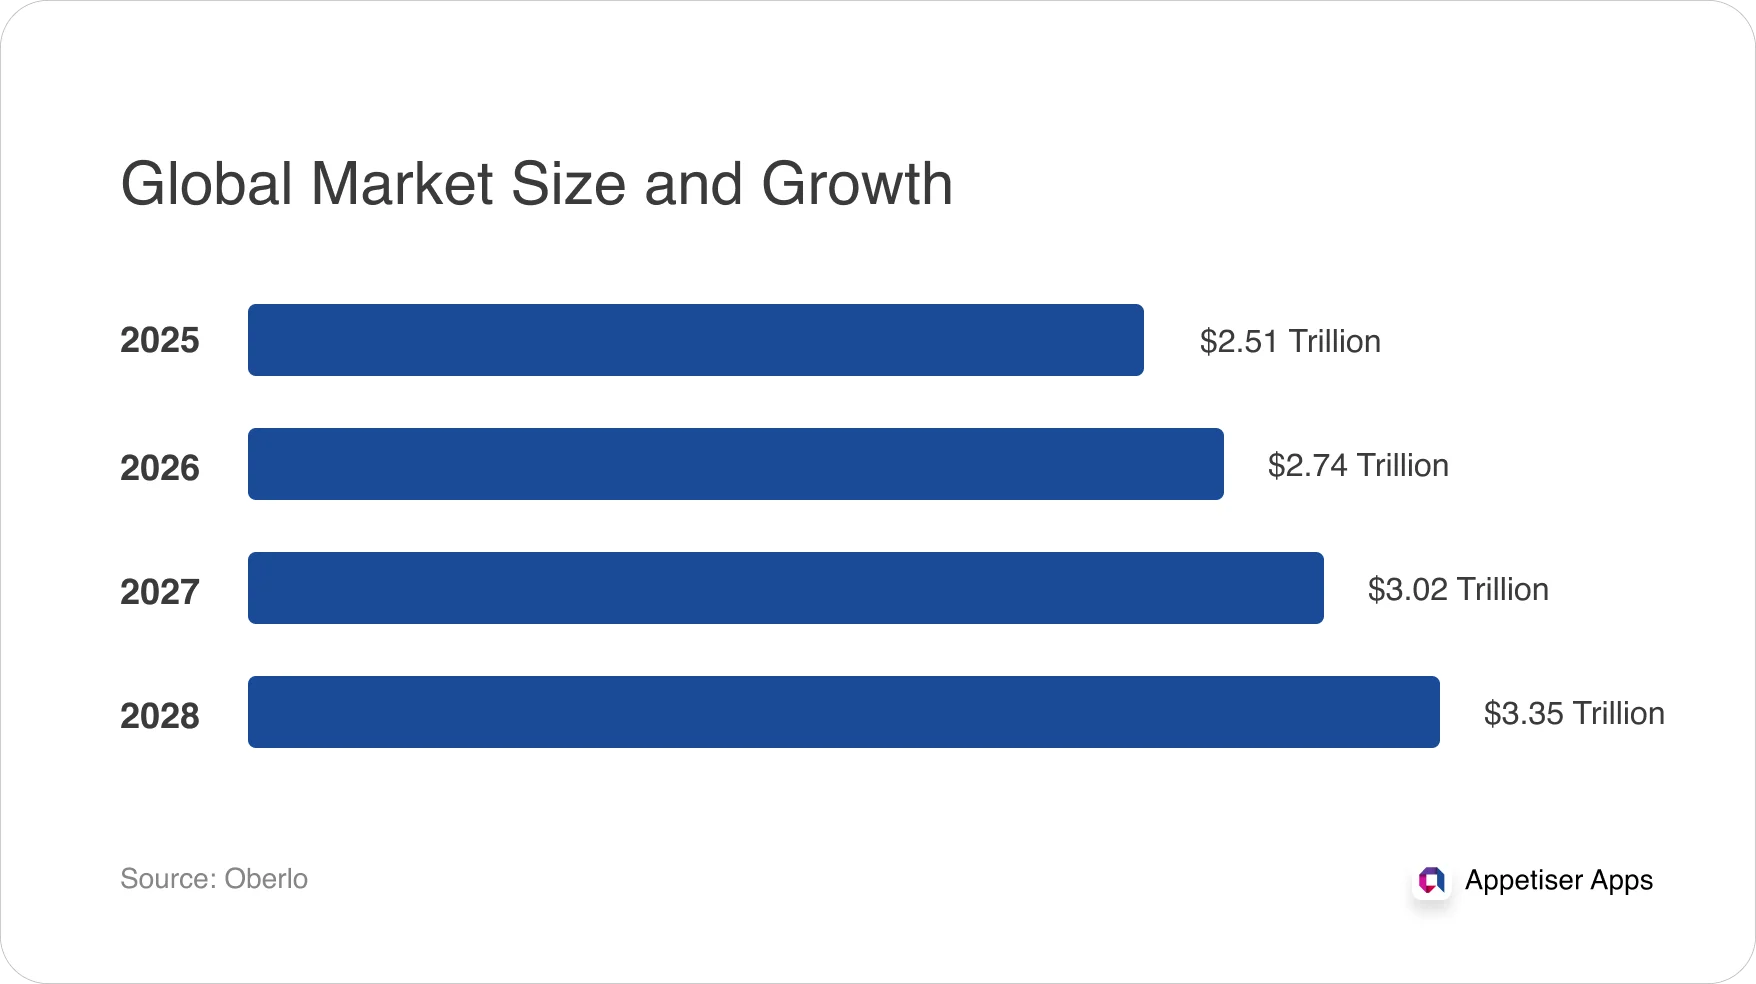
Global Global e-commerce market size and growth
1. Phones now drive the majority of retail ecommerce worldwide, a market that closed 2025 near the $2.24 trillion mark and is pacing toward $2.42 trillion this year. (Source: Fortune Business Insights)
2. By 2027, we’ll be breaking the $3.02 trillion global ceiling in mobile commerce revenues. (Oberlo)
3. Mobile commerce is set to dominate 63% of all online shopping by 2028, showing we’re just scratching the surface. (Statista)
4. By 2028, global online retail sales will grow at an 8.9% CAGR. It will reach $6.8 trillion, with mobile devices playing a central role in this expansion. (Forrester)
5. Despite mobile’s dominance online, 76% (or $21.9 trillion) of global retail sales will still happen offline in 2028. (Forrester)
My key takeaways: Mobile commerce already took the wheel. $2.24 trillion in 2025, $3 trillion by 2027, and 63% of online shopping by 2028. But 76% of retail sales, about $21.9 trillion, will still happen in physical stores in 2028. Now, this is the best time for retail companies and brands to consider omnichannel strategies to win the hearts of customers. Mobile isn’t replacing the store. It’s the bridge.
Consumer behavior and usage
6. Smartphones drove 75% of global retail site visits and 71% of online orders in Q4 2025, the closest the traffic-to-order gap has ever been. (Statista)
7. Weekly mobile shopping is the norm for 30% of online shoppers globally. (Statista)
8.. 5.83 billion people use a mobile phone in 2026, with 7.64 billion smartphones now in circulation. (Source: DataReportal)
9. Americans now spend an average of 5 hours and 16 minutes a day on their phones, up 14% year over year. Gen Z leads at 6 hours and 27 minutes daily. (Harmony Healthcare IT)
10. Desktop converts at 3.9% while mobile sits at just 1.8%, meaning mobile generates 82.9% of traffic but only 40% of revenue. (Foundry CRO)
My key takeaways: Mobile isn’t the future of retail. It’s the current battlefield, and most brands are still showing up with desktop-era armor. Smartphones now drive 75% of global retail visits, and 71% of orders, and 30% of shoppers treat mobile checkout like a weekly ritual. Yet here’s the leak nobody wants to talk about: mobile pulls 82.9% of traffic but converts at just 1.8%, walking away with only 40% of the revenue. That’s not a mobile problem. That’s a UX, speed, and trust problem dressed up as a device gap.
Retailers clinging to desktop-first thinking aren’t being cautious—they’re forfeiting the room where the customers already are. Convenience stopped being a perk years ago. In 2026, it’s the price of entry.
Online shopping statistics by country and region
United States
11. In the U.S., smartphones now drive over 75% of retail website visits and generate roughly two-thirds of online orders, while desktops pull just 24% of retail traffic but still claims 30% of purchases in Q4 of 2025. (Statista)
12. Temu and SHEIN overtook Amazon as the world’s most-downloaded retail apps in 2025, with Amazon still leading in active users (685M monthly) and Temu close behind at 530M, up 48% YoY. (EcomCrew)
13. Social commerce in the US hit $167.95 billion in 2025, with projections pointing to $1.59 trillion by 2033. (Grand View Research)
14. 102.6 million Americans—roughly 1 in 3—are projected to scan QR codes in 2026, up from 99.5M in 2025. (Wave Connect)
My key takeaways: The U.S. mobile shopper has already arrived (smartphones now drive over 75% of retail visits and two-thirds of orders, while desktop’s shrinking 21% of traffic, still punching at 33% of revenue. The phone isn’t a touchpoint anymore — it’s the storefront, the salesperson, and the checkout counter in one palm.
Europe
15. Quick commerce surge: Europe’s quick commerce market hit US$54.9 billion in 2025 and is on track to more than double to US$115.4 billion by 2034, with broader forecasts projecting a 28.3% CAGR through 2035. (Market Data Forecast)
16. Latest forecast reveals a 7.8% annual growth rocket for online sales across Europe-5 (France, Germany, Italy, Spain, UK), blasting from €389 billion in 2024 to €565 billion by 2029. (Forrester)
17. By 2029, nearly 1 in 3 retail pounds (32%) will flow through online channels in the UK—a 19% surge from 2024’s 27%. While Germany and France play catch-up, Britain’s e-commerce dominance isn’t just growth—it’s a marketwide reset. (Forrester)
My key takeaways: This region is still dwarfed by the U.S., where 29% of all retail ($1 in $3) flows digital. Bottom line: Europe bets on phygital hybrids (QR meets brick-and-mortar), while the U.S. demands fealty to Amazon or Walmart or hyper-niche escapes. Choose your battlefield.
Australia
18. 95% of Australians now shop via smartphones, with Gen X (99%) and Millennials (97%) leading adoption. Desktop remains relevant for Boomers (79%) and research-heavy purchases. (InsideRetail)
19. Australians spent a record AU$82.6 billion online in 2025, up 14% YoY, with 9.8 million households (82% of all households) now shopping online and 41% buying at least fortnightly. (Australia Post eCommerce Report 2026)
20. 57% of consumers expect same-day collection options for online purchases, while 77% want real-time order tracking. (eCommerce News Australia)
21. 52% of Australians abandoned a cart in 2025 because checkout was too long or complicated, rising to 67% among higher spenders—and 70% say poor delivery communication at checkout makes them less likely to buy. (Australia Post eCommerce Report 2026)
My key takeaways: Gen X and Millennials aren’t just adopting mobile—they’re rewiring retail DNA. What’s more, the 52% cart abandonment rate isn’t a warning; it’s a death sentence for laggards. There is no excuse for retailers to embrace speed and performance when it comes to their online stores.
Emerging trends in mobile commerce
Social commerce
22. Global social commerce reached $1.64 trillion in 2025 and is on track for $2.11–2.23 trillion in 2026, growing at a 29–35% CAGR. (Precedence Research)
23. US and European shoppers see live commerce as entertainment (42% and 38%, respectively, call it “fun”). (McKinsey)
24. TikTok Shop is forecast to hit $23.41 billion in US ecommerce sales in 2026 (+48% YoY), bigger than Target, Costco, Best Buy, or Kroger online” (eMarketer).
Payment and financial technology
25. The US BNPL market is forecast to hit $127.94 billion in 2026 (+19.1% YoY), on its way to $258.4 billion by 2031. (ResearchAndMarkets)
26. 55% of Gen Z made purchases via social media apps in 2024, with TikTok cited as the #2 platform (after Instagram) for Gen Z shopping. (GoDaddy)
Future technology adoption
27. By 2030, agentic AI is expected to influence 30% of digital commerce transactions, with global revenue orchestrated by agentic commerce projected to reach up to USD $5 trillion. (Deloitte via Australia Post 2026)
28. 2028’s forecast? A whopping $3.35 trillion, with mobile claiming 63% of all online shopping. (Oberlo)
29. By 2028, more than $3 of every $5 spent online will happen through mobile. (Oberlo)
30. The mobile commerce market is forecast to reach $8.07 trillion by 2034 at a 25.7% CAGR. (Fortune Business Insights)
My key takeaway: Social platforms are now trillion-dollar storefronts. The global social commerce hit $1.64 trillion in 2025 and is pacing toward $2.11–2.23 trillion in 2026, with live commerce blurring the line between shopping and entertainment.
TikTok Shop alone is forecast to generate $23.41 billion in U.S. sales this year, outselling Target, Costco, Best Buy, and Kroger online — proof that Gen Z’s social-first buying habits are forcing brands to prioritize platform-native, creator-led, shoppable content over traditional product pages.
Meanwhile, the checkout and infrastructure layer is catching up fast. The U.S. BNPL market is on track to hit $127.94 billion in 2026 (+19.1% YoY) and $258.4 billion by 2031, making installment options a non-negotiable at mobile and social checkout.
Looking further out, mobile commerce is set to exceed $5 trillion by 2028 and $8.07 trillion by 2034, while agentic AI is projected to influence 30% of digital commerce transactions by 2030.
Winners won’t be the ones chasing 5G or AR someday. They are the ones optimizing today for AI-readable product data, three-tap checkout, and BNPL baked into every social flow.
Final thoughts
The future is clear. Mobile commerce isn’t just about making online purchases; it’s about redefining retail through mobile-first strategies that align with nearly half of global internet users now shopping on mobile phones.
Whether you’re looking to develop eCommerce app or simply get to market quickly, our team has the expertise and experience to get you there.
Contact us today for a free consultation to get a clear direction for your app idea.
People also ask about the e-commerce market
1. How much will global mobile commerce sales reach by 2026?
Global mobile commerce reaches $2.42 trillion in 2026, up from $2.24 trillion in 2025, and is forecast to hit $5.01 trillion by 2034 at a 9.5% CAGR. Asia-Pacific leads with 42.66% of the market, while North America is set to reach $592.63 billion in 2026 (Fortune Business Insights)
2. What percentage of online sales come from mobile devices?
Mobile devices drive 59–60% of global ecommerce sales in 2026, up from 43% in 2018, with that share projected to reach 63% by 2028, meaning roughly $3 of every $5 spent online flows through a smartphone, while mobile already accounts for 82.9% of all ecommerce traffic (Statista).
3. Why do mobile shoppers abandon carts on mobile sites?
The average mobile cart abandonment rate is 85.65% versus 73% on desktop, driven by complicated checkout (52% of shoppers, rising to 67% among higher spenders), slow delivery (44% leave if shipping exceeds 2 days), and unexpected costs. One-tap checkout, Apple Pay, and Google Pay directly lift conversion (SOTI, Australia Post 2026).
4. Do mobile shoppers prefer apps or mobile websites in 2026?
85% of U.S. mobile shoppers prefer apps over mobile websites because of faster speed, smoother UX, and one-tap checkout. Apps convert at 3.5% versus 2% on mobile web (a 75% lift), and mobile app users make twice as many purchases as web users, making apps the default channel for serious mobile retailers (Droids on Roids).
5. How does social commerce impact retail ecommerce sales?
Global social commerce reached $1.64 trillion in 2025 and is pacing toward $2.11–2.23 trillion in 2026, with TikTok Shop alone forecast to generate $23.41 billion in U.S. sales (+48% YoY)—outselling Target, Costco, Best Buy, and Kroger online. Social commerce is mobile-first, since 95%+ of social usage happens on smartphones (Precedence Research, eMarketer).

Maria Krisette Lim is a Content Marketing Specialist with 14 years of experience producing web and print ad content. Krisette has a BSBA degree, major in Business Management and Entrepreneurship. When she’s not tinkering with words and punctuation, she’s either curled up with a book while sipping hot tea, playing with her toddler, or tinkering with website builders.