How to Measure Product Success to Improve Business Outcomes

It can be tempting to spend heavily on expansion when you see large groups of customers coming in or a flood of users trying your website or app.
But how sure are you that your scaling strategy yields the optimum return on investment?
At Appetiser Apps, we have helped organizations achieve multi-million dollar growth. We start by analyzing various metrics to assess how well their products are performing, allowing us to create sound strategies.
If this is something you want to replicate for your business, read on. This article will teach you the metrics you must track to ensure your growth strategy is based on sound data and not pure guesswork.
In particular, I will tackle:
- The definition of product success
- Why you should measure product success
- Product success metrics to help you improve financials, product features, and operations
Let’s begin.
What is product success?
Product success evaluates a product or service’s efficiency and influence in the market. Metrics or a set of formulas have been devised to give precise shape to this concept. But to ensure the most optimal strategy for long-term success, tech startups and businesses must not only calculate product success metrics well. They must also choose the right set of measures to accurately assess their product’s impact on revenue, brand perception, and profitability.
Why is measuring product success important?
Measuring product success is crucial in guiding decision-makers toward developing strategies for enhancing and modifying products. Such measures also provide insights into how a company’s products contribute to its success, enabling it to sustain or replicate effective processes. Lastly, product success metrics can help attract more investments for expansion or scaling operations.
Though measuring product success is necessary to attract investments, there are other ways to get more funding for business expansion. For instance, social media startup Vello was able to attract funding worth around $600,000 using a prototype. With this money, former athlete Ben Dixon developed an app that has reinvented how celebrities and fans connect. Check out the Vello case study to learn more about this unique expansion story.


Key Product Success Metrics and the Aspects of Business They Can Enhance
As mentioned earlier, product success metrics can be used as the basis to get more investments or to know which features or processes to keep, eliminate, or improve. Let’s discuss two main groupings of product success metrics, which are:
- Financials
- Business Operations / Product Features
Financials
The measures of product success categorized here are especially useful for building a business case. Whether you’re pitching to investors or forming partnerships with other organizations, showing them that your product or service is a good source of income would better convince them to get on board.
Below are some financial-oriented product success metrics. You can take advantage of these metrics whether you’re a traditional business or someone reliant on digital assets like apps and websites to generate revenue.
- Monthly Recurring Revenue (MRR)
- Average Revenue Per User (ARPU)
- Customer Lifetime Value (CLTV)
- Customer Acquisition Cost (CAC)
Monthly Recurring Revenue (MRR)
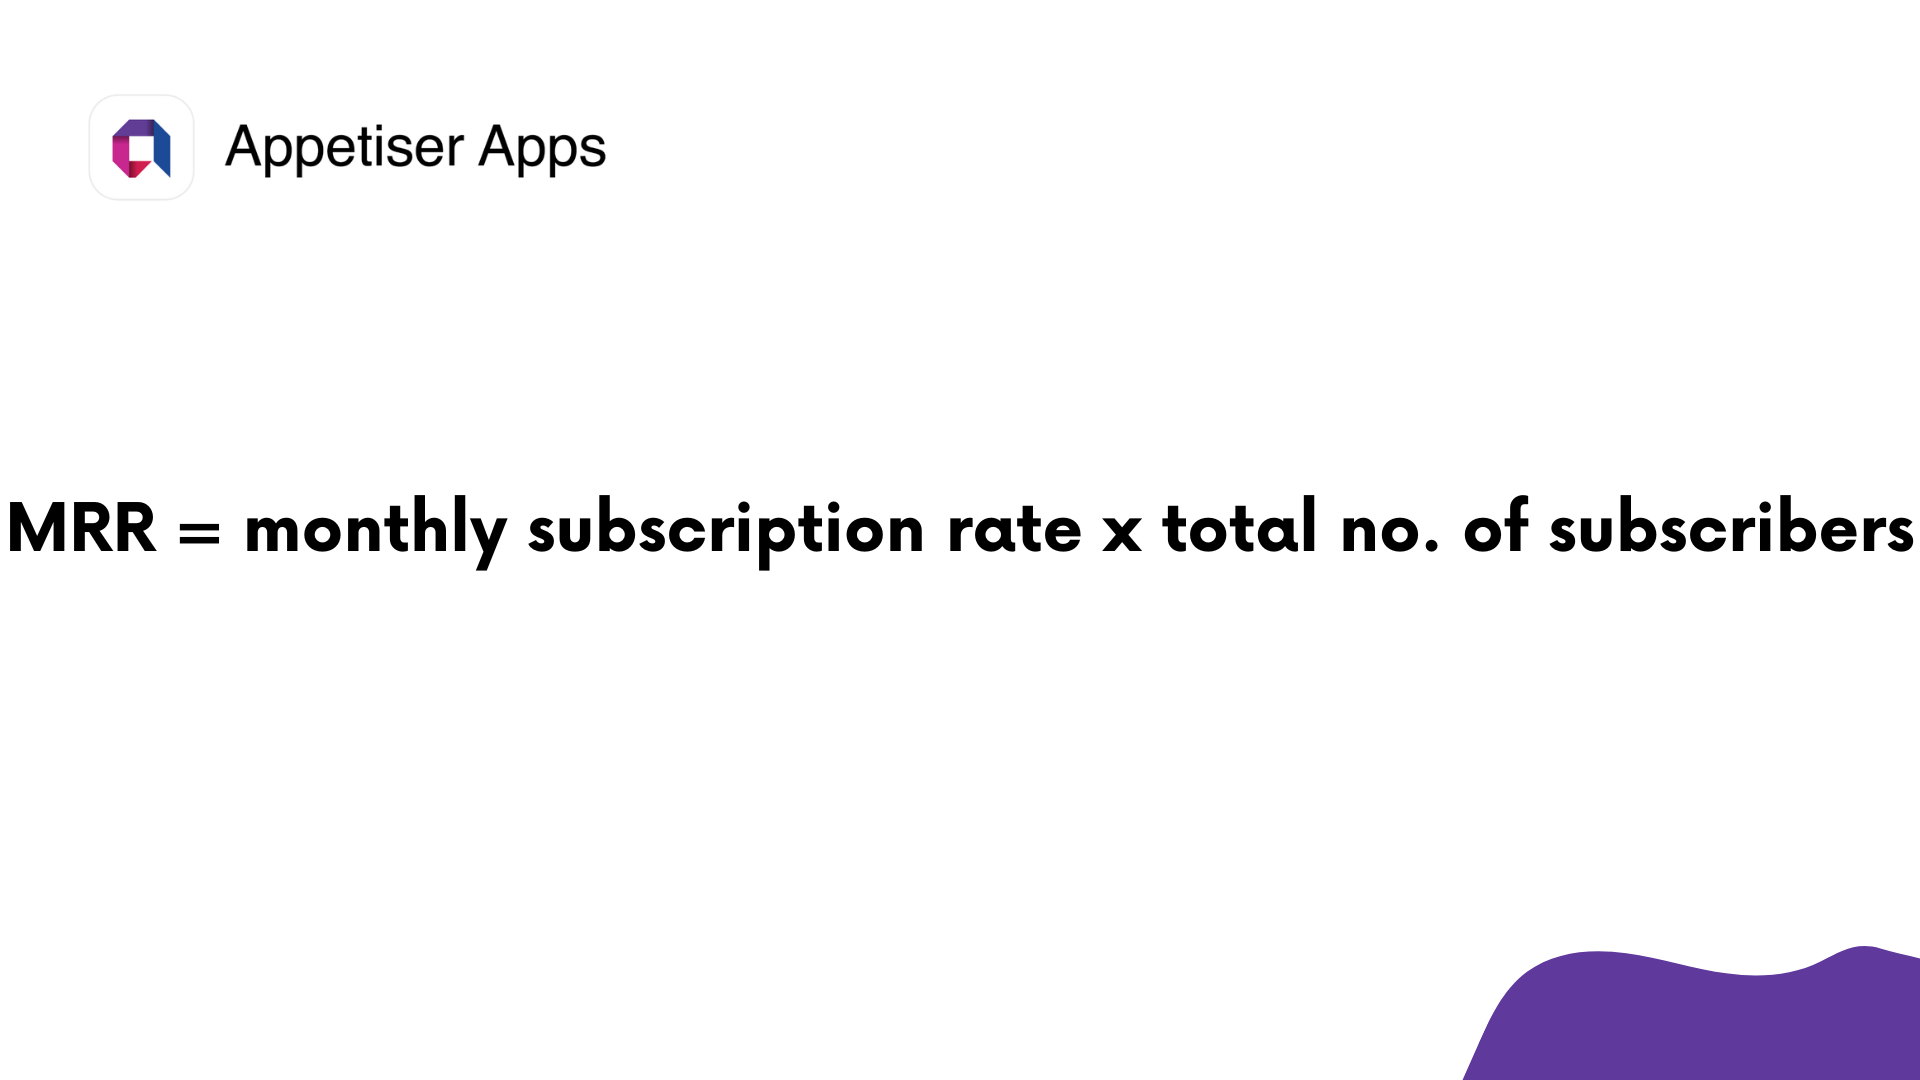
Monthly recurring revenue (MRR) represents the total expected revenue generated in a month. This metric is particularly valuable for startups running the Software-as-a-Service (SaaS) model or any other business model with fluctuating income and expenses.
To calculate MRR, simply multiply the monthly subscription rate by the number of subscribers. If customers pay annually, divide their yearly amount by twelve to find their monthly rate.
Let’s think big for a moment.
Suppose you’ve set up an app business in record time while managing costs through outsourcing app development. After a few months of launching your app, you have gathered 10 basic version users paying $100 each and 5 advanced version users paying $250 each. From these figures, your MRR would be calculated as:
(10 x $100) + (5 x $250) = $2250
What if you’re not using an app to generate income for your business?
The MRR formula can still help you determine your business’s financial viability. But the beauty of digital products like apps is that they not only expand your customer base but also make it easier for you to track monthly revenue. Curious how this is so? Book a free consultation with us and explore other ways to manage and grow your business in an increasingly mobile world.
While MRR is a primary indicator of financial health, it’s also essential to look at customer satisfaction and usage frequency. Failure to retain customers or understand their usage patterns can lead to a decline in MRR over time.
Average Revenue Per User (ARPU)
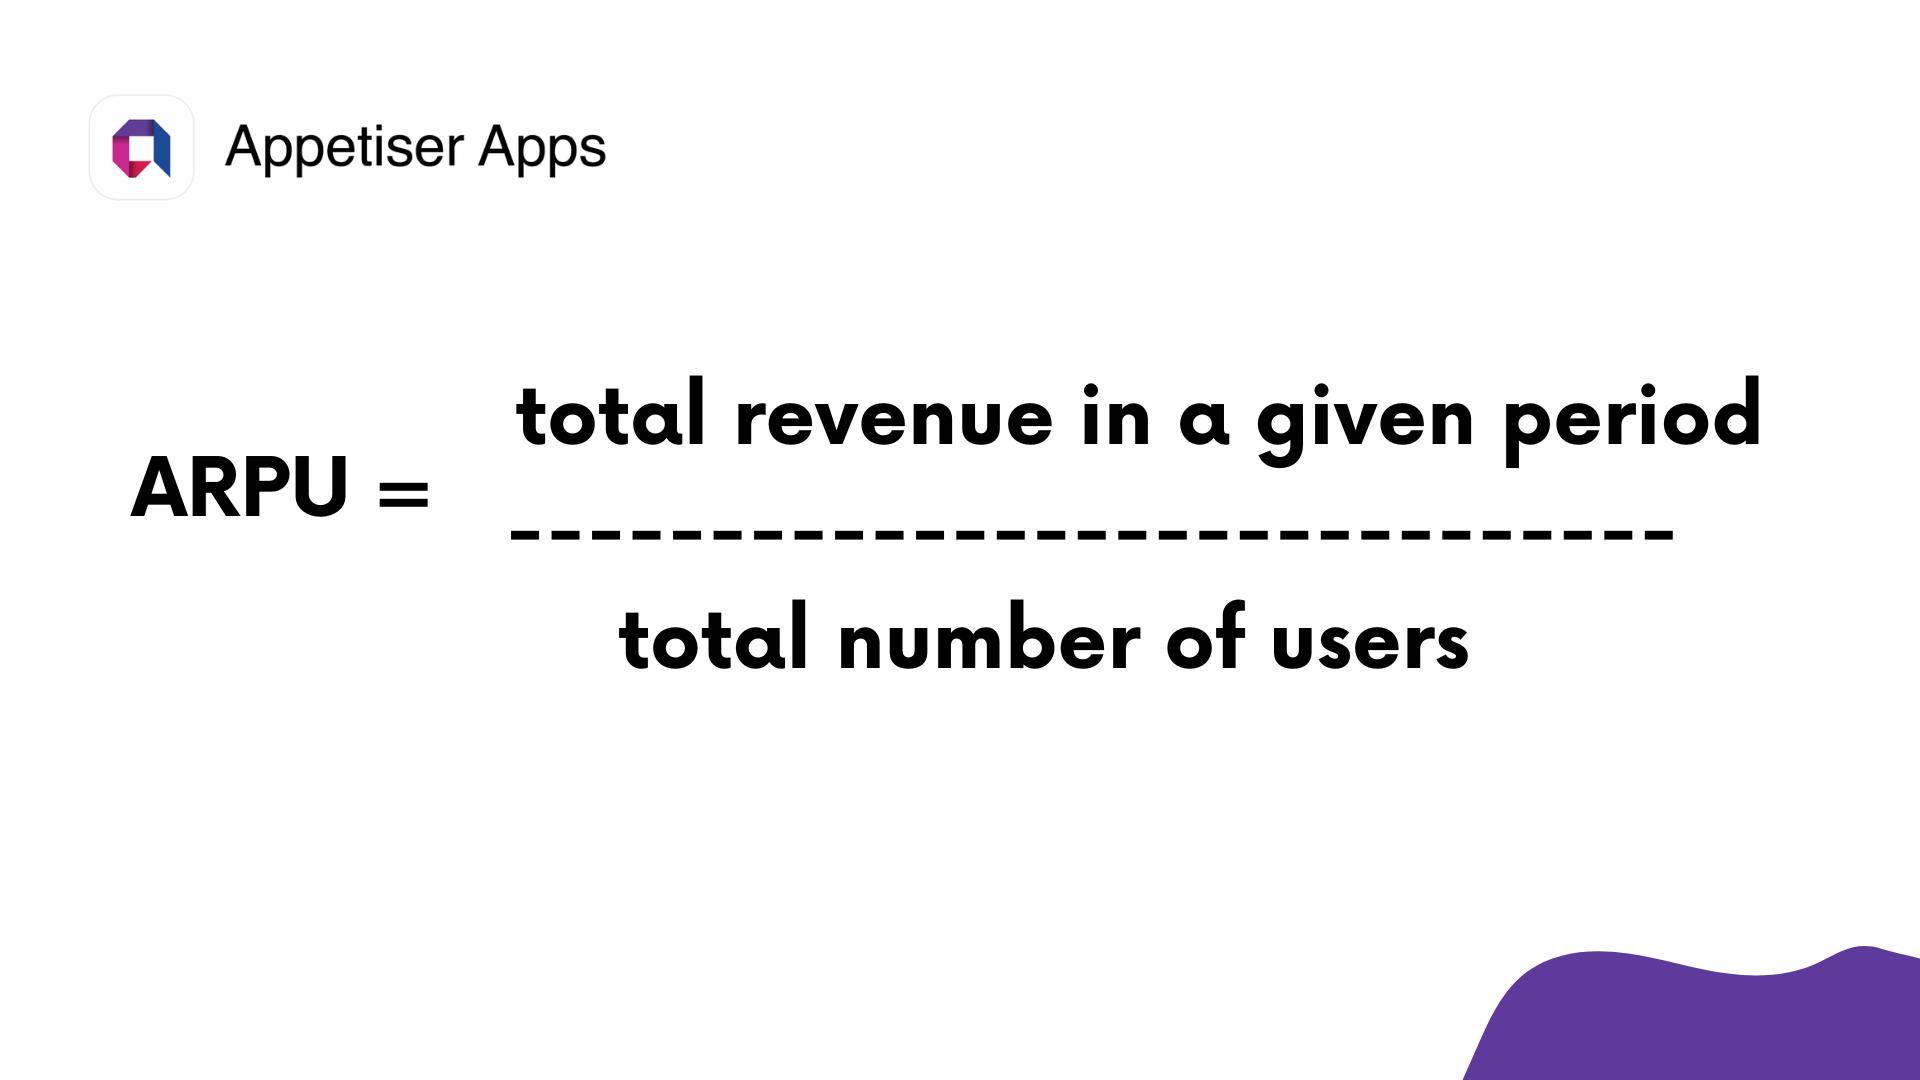
Another key indicator for measuring the success of a product is Average Revenue Per User (ARPU). It reveals how much income is generated per user within a particular timeframe. You can tweak the metric to accommodate monthly or annual income or include both new and existing customers.
To calculate ARPU, simply divide the total revenue generated within a given period by the total number of users.
ARPU is crucial mostly for digital products such as eCommerce platforms, online gaming, and travel applications. It accounts for various revenue streams, including subscription fees, one-time purchases, and additional income sources like upsells, cross-sells, or advertising.
Customer Lifetime Value (CLTV)
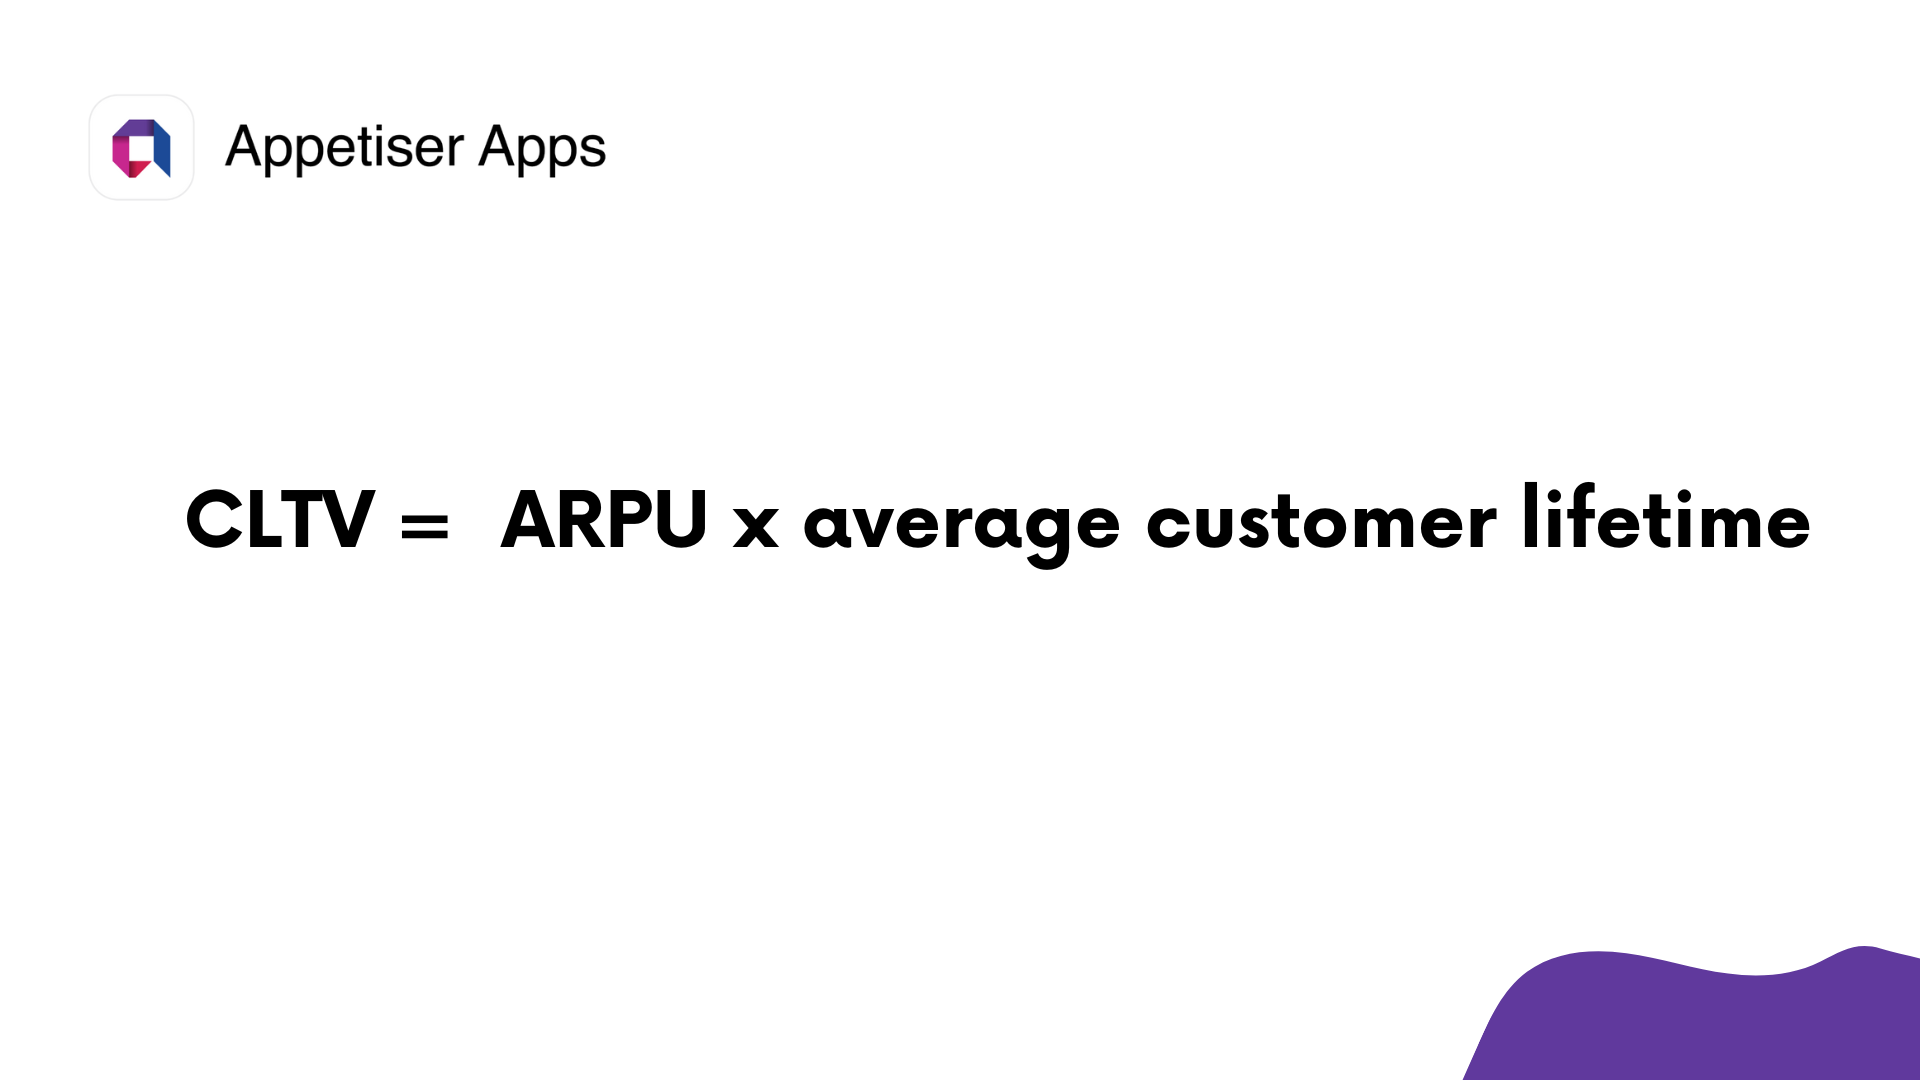
Customer Lifetime Value (CLTV), also known as LTV, is a vital metric for gauging a product’s potential success. It calculates the projected revenue from a customer over their entire tenure as a paying user. It offers broader insights than Average Revenue Per User (ARPU).
To compute CLTV, simply multiply ARPU by the average customer lifetime.
The term “user” here could also mean “customer.” For instance, let’s assume you’ve been running a computer repair shop for three years now. In that period, say you acquired three customers (for simplicity’s sake).
In the past three years, you’ve noticed that Customer 1 has earned you $2,000, Customer 2 has generated $1,500, and Customer 3 brought in $700. The first customer has stayed with your company during the entirety of your business while Customers 2 and 3 stopped showing up after one year.
From here, you can calculate the ARPU:
ARPU = ($2,000 + $1,500 + $700) / 3 customers
ARPU = $1,400
Then calculate the average customer lifetime by adding the total number of years that the 3 customers stayed (which is 5 years), then divide by 3. Your average customer lifetime value is 1.67 years.
Now that you have the ARPU and the average customer lifetime, multiply 1.67 and $1,400, and you get a CLTV of $2,338. That amount is what you earn from the customer’s entire duration of engagement with your company.
Rather than focusing on general metrics like Monthly Recurring Revenue (MRR), CLTV emphasizes the unique contribution of each customer. It illustrates the long-term value of your customer base by revealing the average revenue per user before they cancel their subscription or stop doing business with you.
Assuming you have high CLTV stats, it will enable you to convince investors and other stakeholders that you can generate high income per customer during the entirety of their dealings with your company.
Customer Acquisition Cost (CAC)
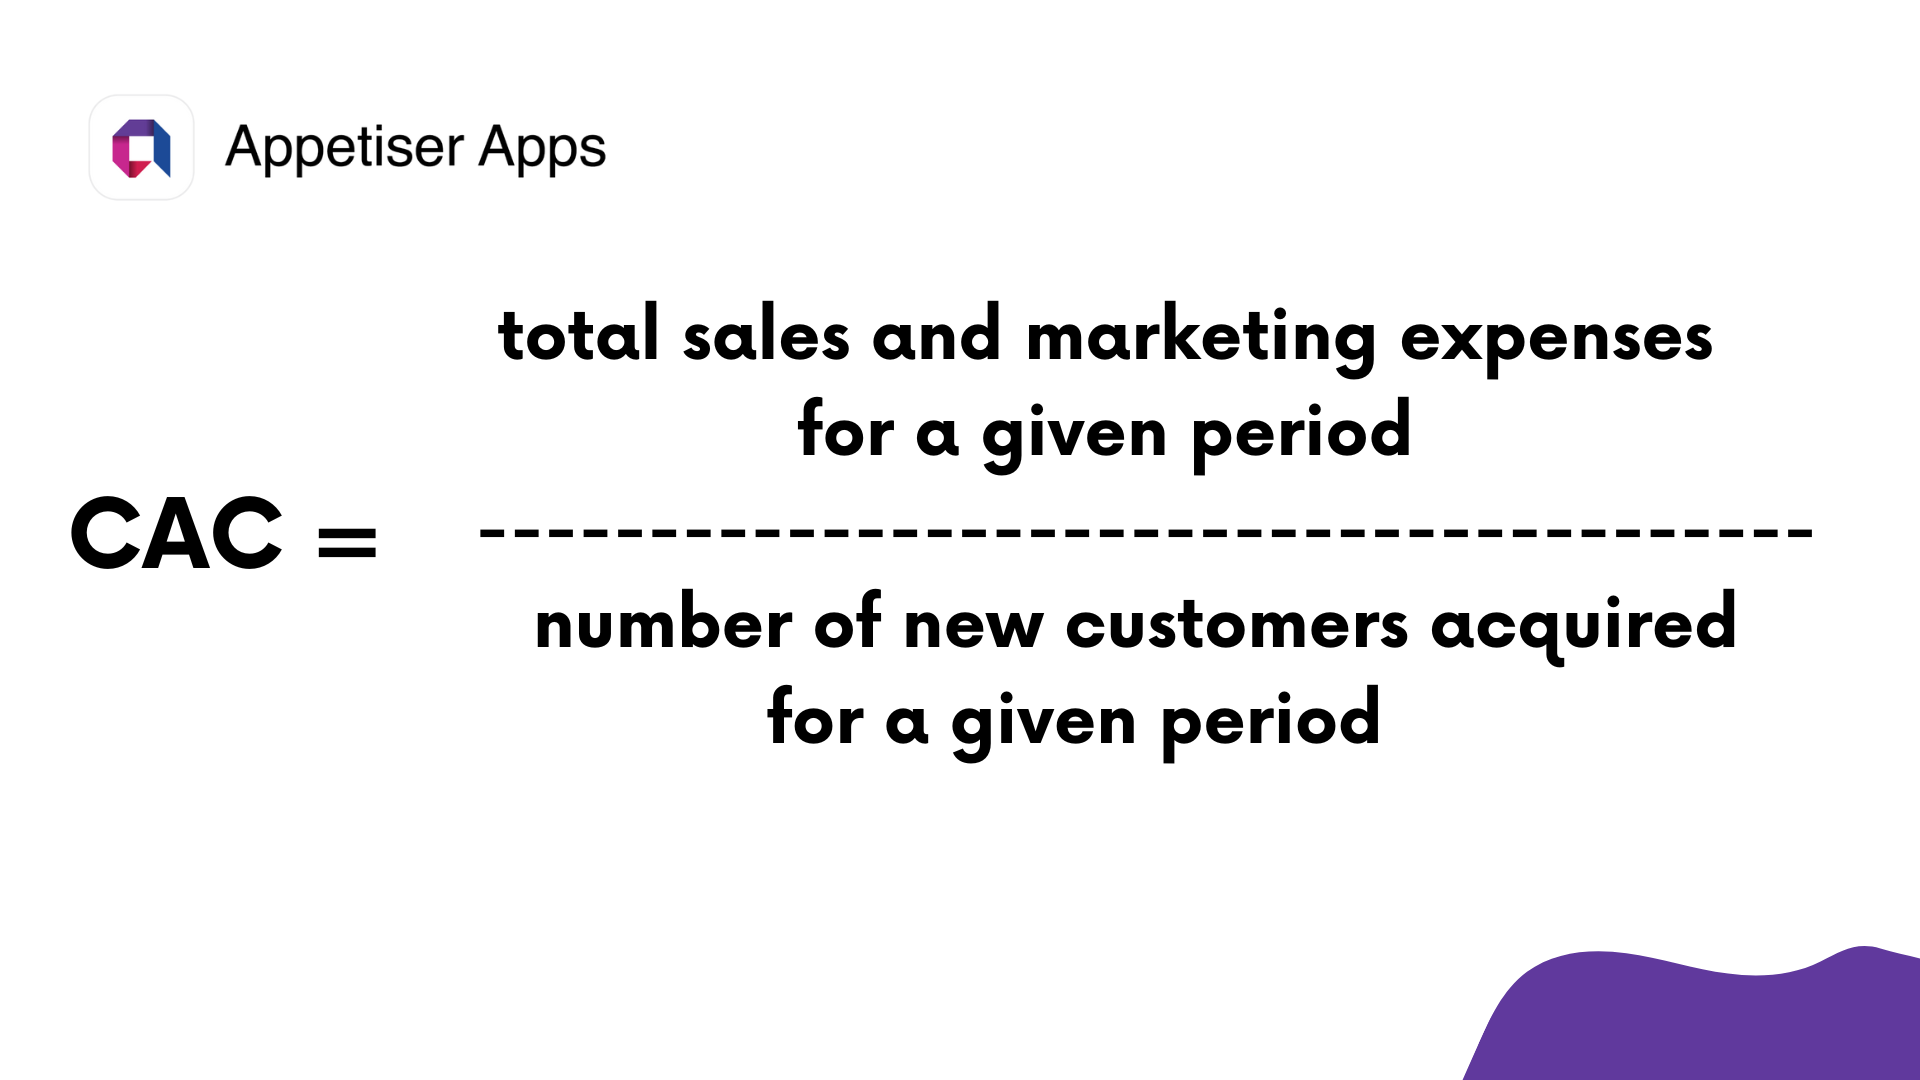
CAC assesses the average investment your business makes to acquire a new customer, factoring in sales and marketing expenses over a specific period. Aside from the cost of things like ad materials or subscriptions to run digital marketing campaigns, the salaries of your sales and marketing team are also included in the CAC computation.
To calculate CAC, divide total sales and marketing expenses for a period by the number of new customers acquired in the same timeframe. This metric helps in decision-making, such as pricing adjustments or refining marketing strategies.
To understand CAC better, let’s assume you just opened a new restaurant. For the first six months of its operation, you spent $1,000 promoting your business on digital channels like social media, $500 printing flyers, and $500 paying your social media experts and flyer distributors. During that time period, you attracted a total of 500 customers.
Using the CAC formula, add your total expenses (equal to $2,000 if you add all the three costs mentioned) and divide it by 500. You will get a CAC equal to $4. This means you spend around $4 to attract one new customer.
Now to know if your CAC is too high or too low for your business, use it alongside your Customer Lifetime Value (CLTV). A healthy ratio between CAC and CLTV is typically around 1:3 or 1:4. What this means for the restaurant example is that if your CAC is $4, your ideal CLTV must be $12 to $16. In other words, for every $4 you spend to get a new customer, you must earn at least $12 from that person before they decide to stop eating at your restaurant.


Now that you know how to check if your financials are good enough to present to potential investors and business partners, it’s time to move to the metrics that can help optimize your business operations.
Business operations / Product features
Precisely measuring product success serves another important role in businesses: it can pave the way for improving operations, product features, or service delivery.
Whether you’re running a traditional business or deriving income through digital assets like mobile apps or websites, the way we categorized the product success metrics below could help set you up on the right strategy.
Metrics for digital businesses
Digitalization has pushed many entrepreneurs and companies to leverage digital assets like web apps, mobile applications, and websites for revenue growth. Therefore, improving their product or service delivery requires having a look at the following metrics that are only applicable to such tech-driven businesses:
- Active User Percentage (DAU, MAU)
- Traffic (Organic/Paid)
- Session Duration
- Bounce Rate
Active User Percentage (DAU/MAU Ratio)
While acquiring app or website users is crucial, app success is more than a numbers game. What good will it do your business if you know how many users downloaded your app but are unsure if people actually use it? Other factors such as user engagement, retention, satisfaction, and overall impact on the users’ lives or businesses are also important indicators of success.
Tracking active users provides more meaningful insights for many businesses. One of the most important indicators is the DAU/MAU ratio. Calculating this ratio monthly helps signal product growth or decline in digital products like mobile apps, social networks, and online gaming platforms.
The DAU/MAU ratio is indispensable for optimizing monetization strategies. Segmentation of this data provides insights into user behavior, which can aid in identifying what specific features or content segments you can enhance to generate more income.
The said ratio can be calculated by dividing the number of unique users on a given day by the number of active users in a given month, then multiplying that value by 100. Take note that DAU/MAU ratio is calculated for a particular day.
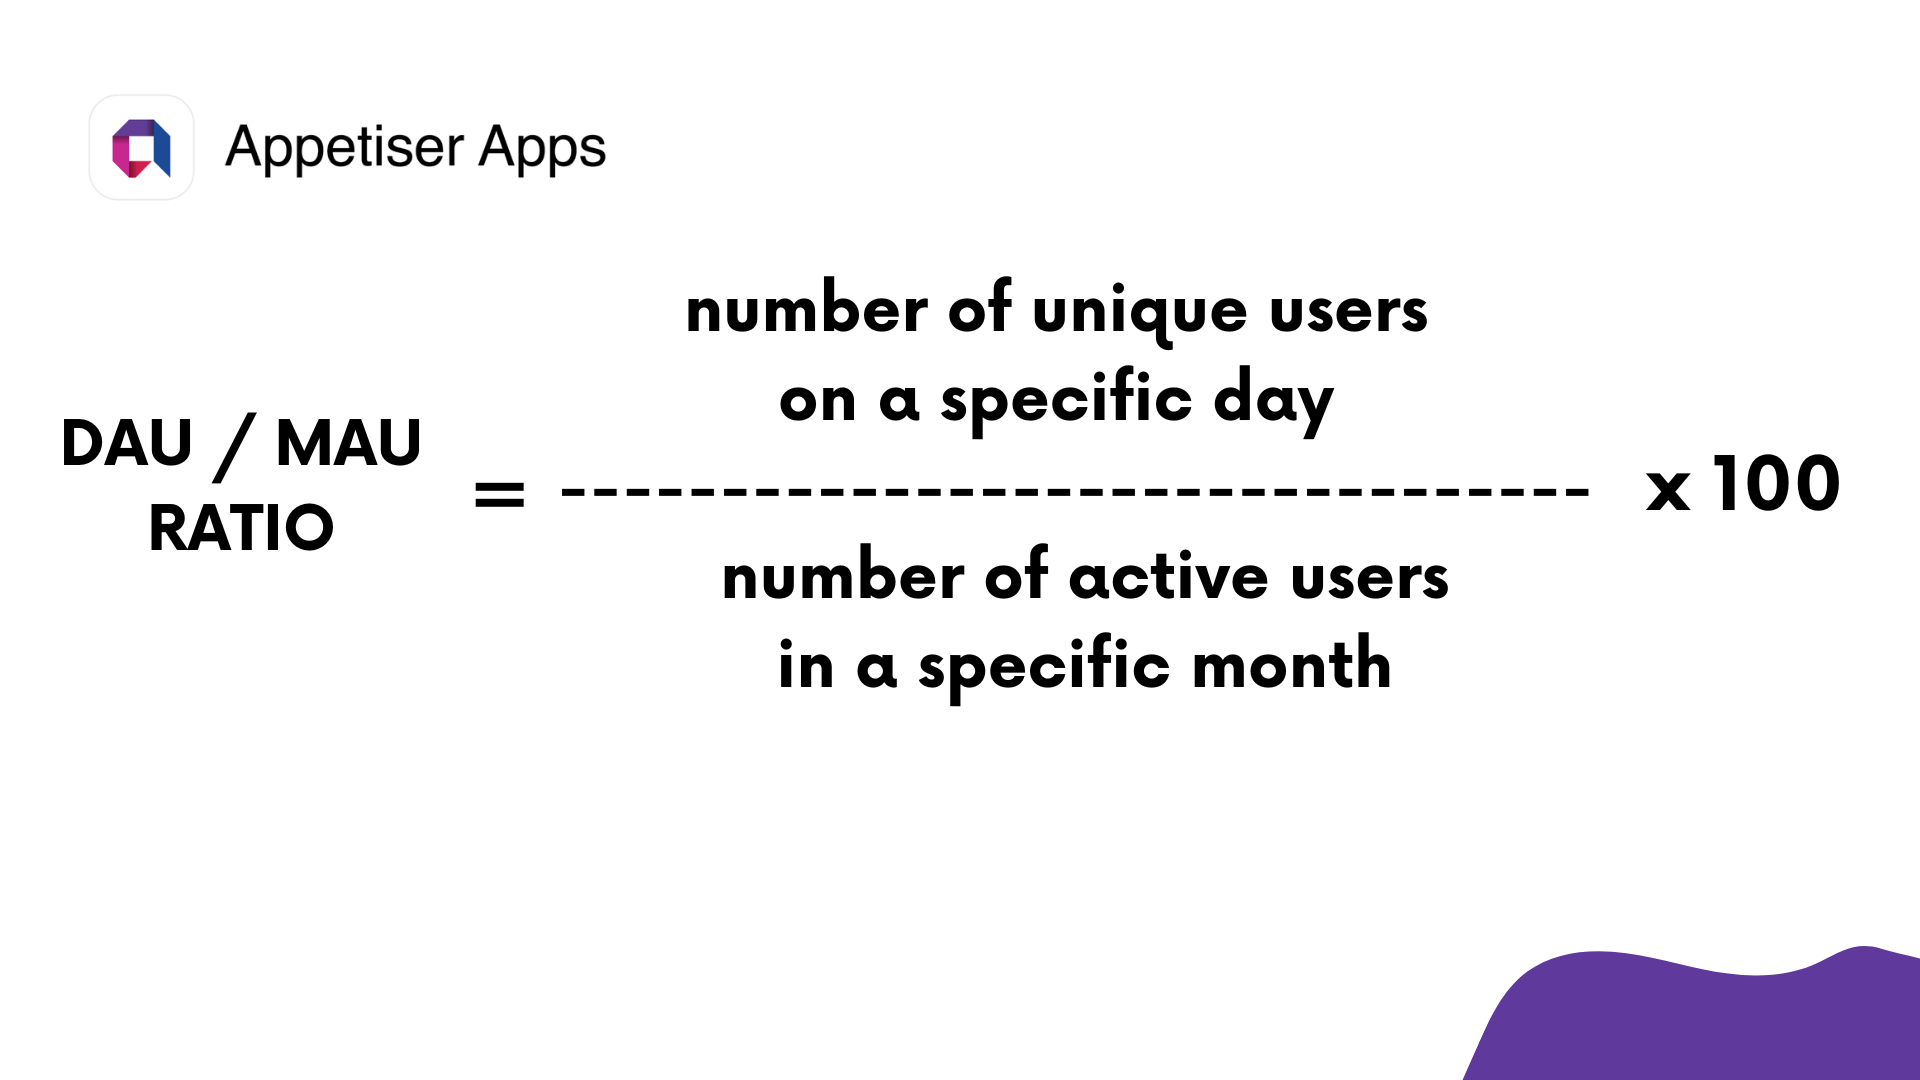
Imagine a scenario where 500 users actively used your app in February of this year. Using mobile analytics tools, you determined that 100 different users used your app on the third day of the same month. That means your DAU/MAU ratio is 20% for February 3 of this year. This value is derived by dividing 100 by 500 and multiplying the result by 100.
Any extremely low DAU/MAU ratios for multiple days across many months could be a sign of poor app performance and other feature issues.
Traffic (Organic/Paid)
Traffic metrics reveal how many visitors have discovered your website, distinguishing between organic and paid sources. Organic traffic represents visitors who found your site through search engines, while paid traffic consists of those who clicked through from paid advertisements.
Analyzing traffic metrics helps assess the effectiveness of distribution channels, enabling you to allocate resources to the most profitable mobile marketing strategies and other related techniques.
For instance, if you see that most of your site visitors came through paid advertising, you could either invest more in this marketing method or find ways to cut costs by writing blogs that rank high on search engines. After all, maintaining a blog’s ranking incurs lower recurring expenses compared to search ads.
Additionally, exploring OTT advertising can help you reach a wider audience through streaming platforms, complementing your paid and organic strategies.
Interpreting traffic metrics also allows you to evaluate the performance of paid marketing campaigns. By monitoring trends in paid traffic, you will know whether you’re attracting enough visitors so your site or app can earn more than what you spend for search ads.
Ultimately, correct analysis and appreciation of site traffic data lead to long-term financial success for your digital asset.
Session Duration
Session duration is another key metric in evaluating the success of a digital product. It measures the amount of time users spend engaging with an app or website and is typically provided by product analysis tools.
When a user opens a website or app, session duration begins. It ends when they exit or close it.
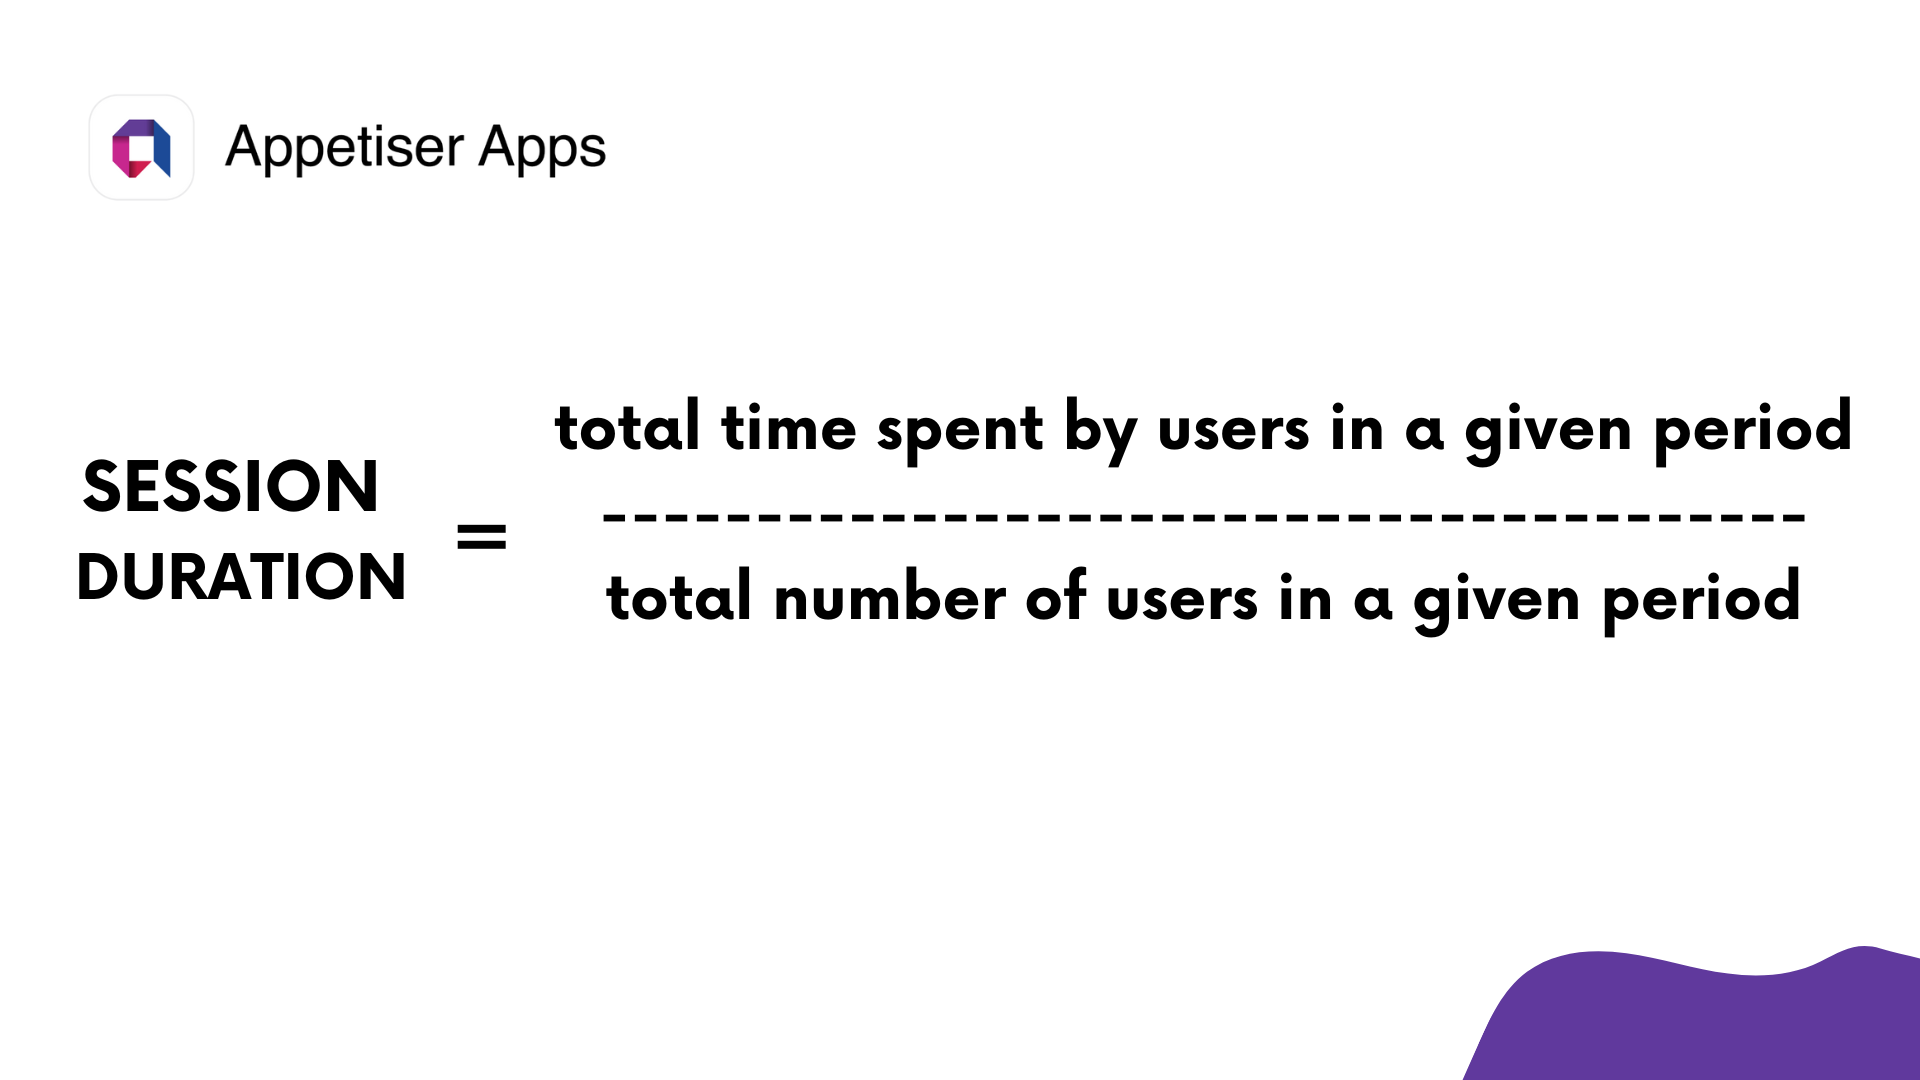
To calculate the average session duration, divide the total time spent by users in a given period by the number of users in the same period.
 ]
]
However, this metric isn’t flawless, as it doesn’t consider inactive time while a user is logged on.
Despite its limitations, understanding session duration is crucial for identifying both the strengths and weaknesses of your product.
By examining session duration alongside other indicators and segmenting data by channels, you can uncover valuable insights to enhance user interaction and overall product experience. For example, examining the session duration of churned users (those who drop out or log out) can help you pinpoint areas for improvement.
Also, evaluating the session duration of top users can help you identify standout features or web pages that you can develop further. Knowing what enhancements to prioritize helps you make better use of your financial resources
Bounce Rate
Bounce rate is a key metric in assessing how many visitors leave your website or app after viewing only one page. It indicates whether your site or app captures users’ interest and usefulness.
You can calculate the bounce rate by dividing the number of users who view just one page by the total number of users or visitors. Then multiply that result by 100 to get a percentage value.
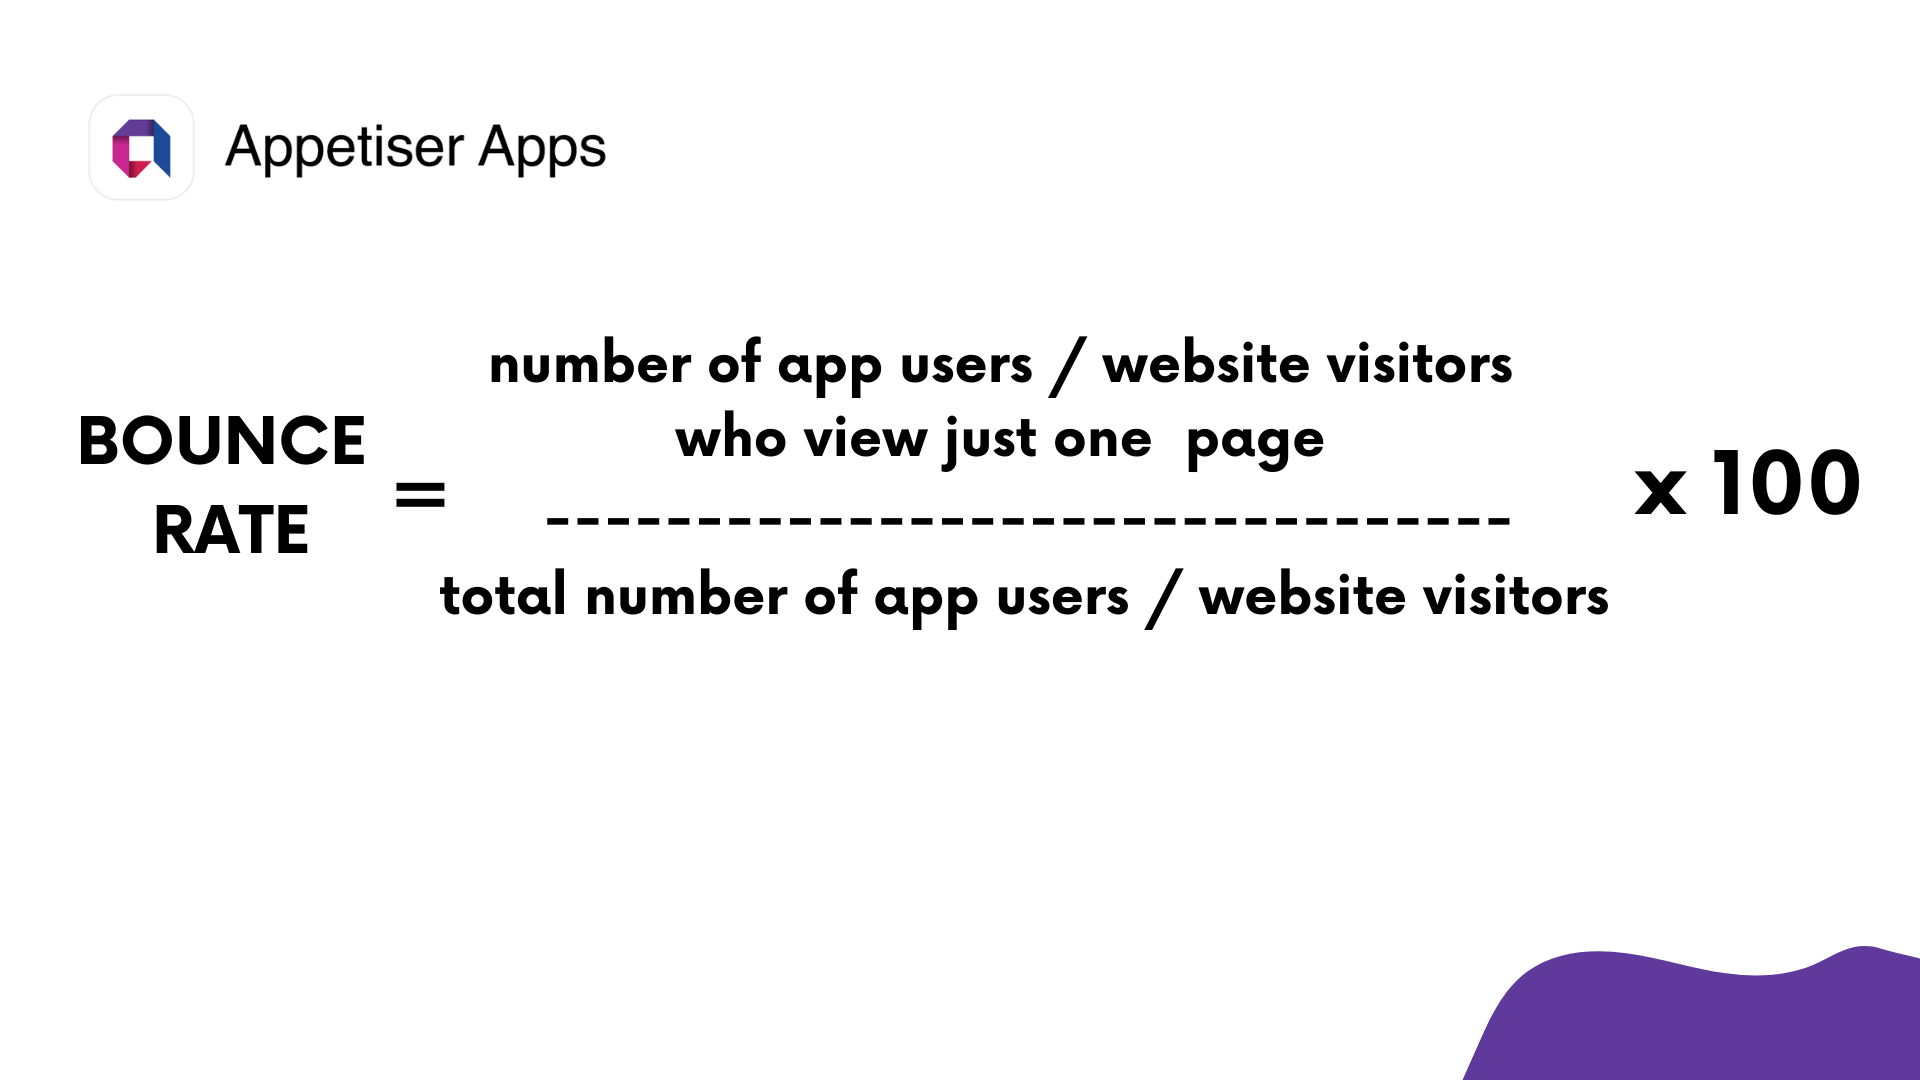
For example, in a given month, you saw that out of the 1,000 users, around 200 bounced or viewed just one page. Dividing 200 by 1,000, and you get a result of 0.2. Multiplying that by 100 and you get a bounce rate of 20%.
An extremely high bounce rate could mean any of the following issues that you need to look into:
- Your paid search ads or social media campaigns don’t reach the right market or audience
- The information and style of your website content don’t match what people want or need
- A mismatch between marketing messages and your app’s features
In summary, understanding and reducing bounce rate is essential for optimizing your product and or tweaking your marketing strategy.
Metrics applicable to both digital and traditional businesses
Both digital and non-digital businesses can enhance the way they produce goods or provide services by paying attention to the following product success metrics (note that the terms “users” and “customers” can be used interchangeably in this section of the article):
- Churn Rate
- Net Promoter Score (NPS)
- Client Retention Rate (CRR)
Churn Rate
Churn rate t represents the percentage of customers who have discontinued using a product or canceled a service subscription within a specific timeframe. It is a metric commonly used in business to measure customer retention and loyalty.
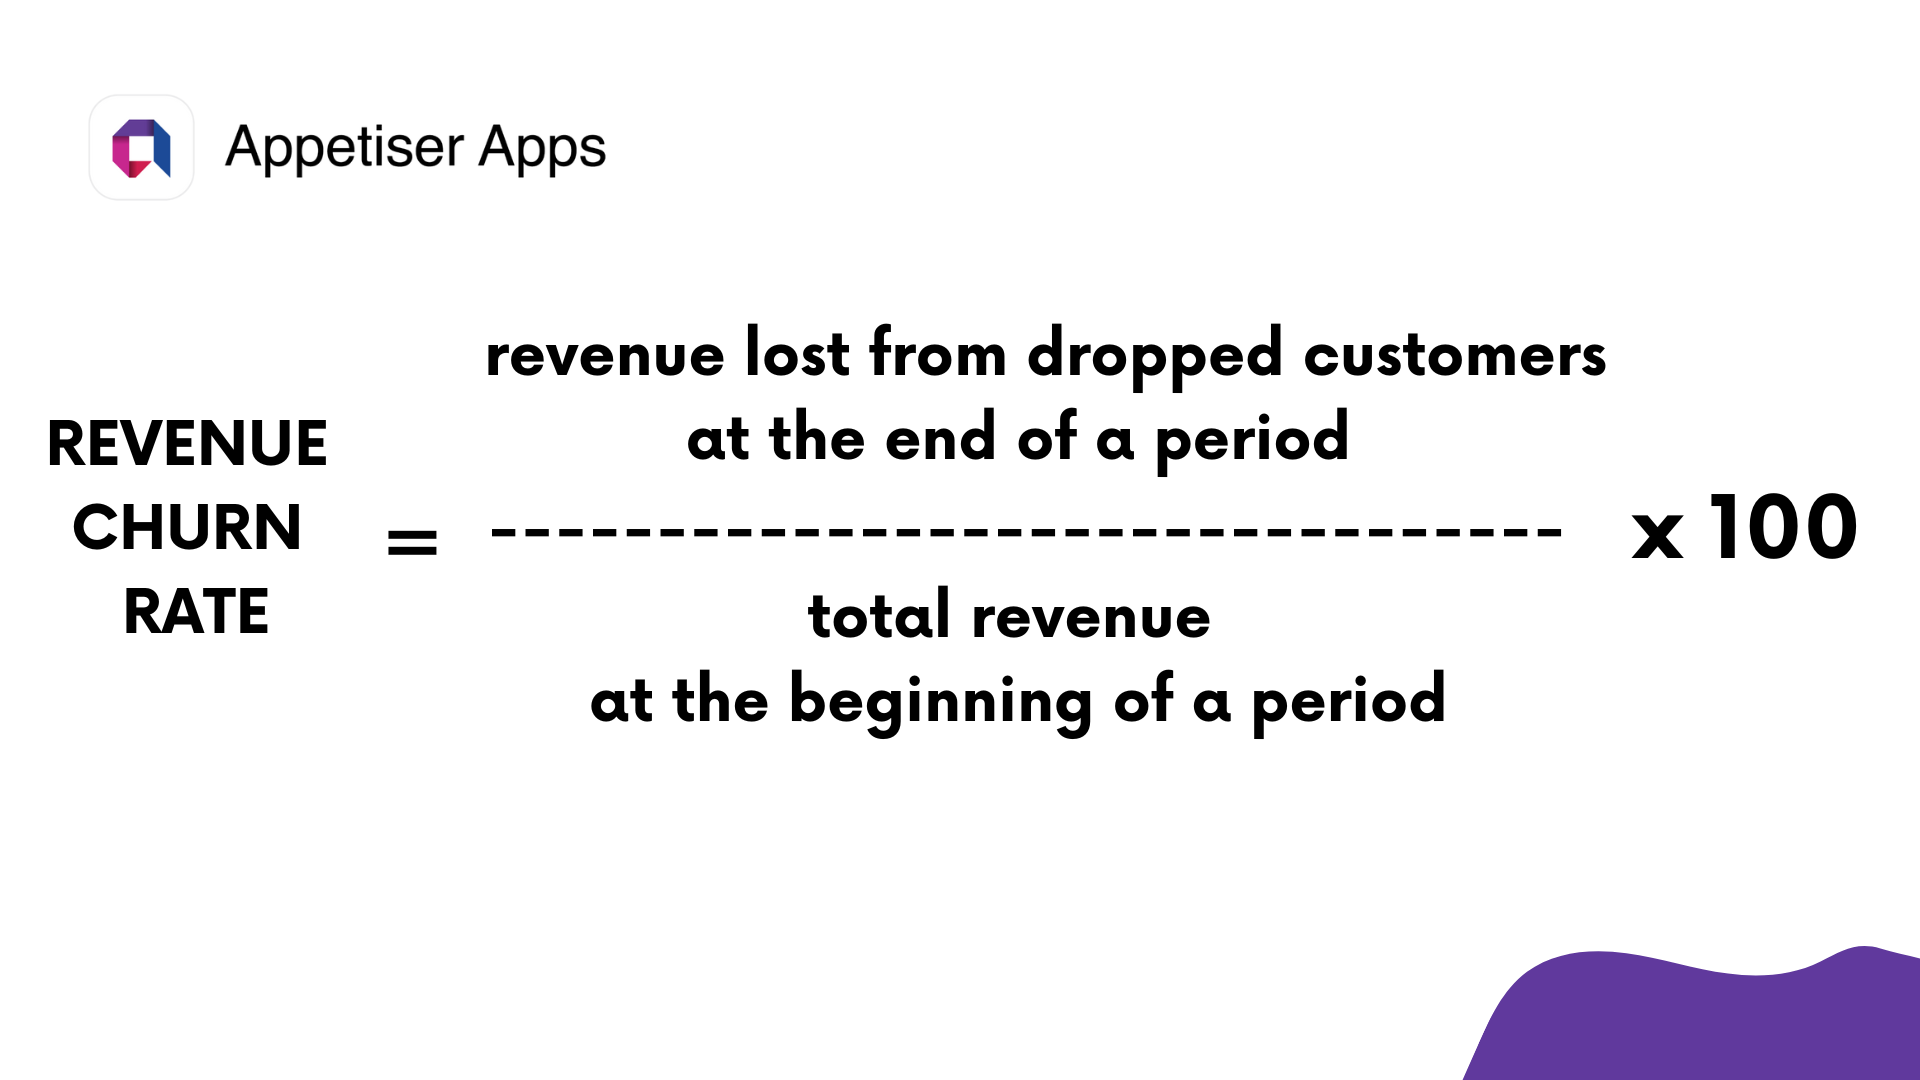
There are two primary approaches to measuring churn rate: customer churn (the number of users canceling paid subscriptions or ceasing from visiting your website) and revenue churn (the revenue lost due to customer churn).
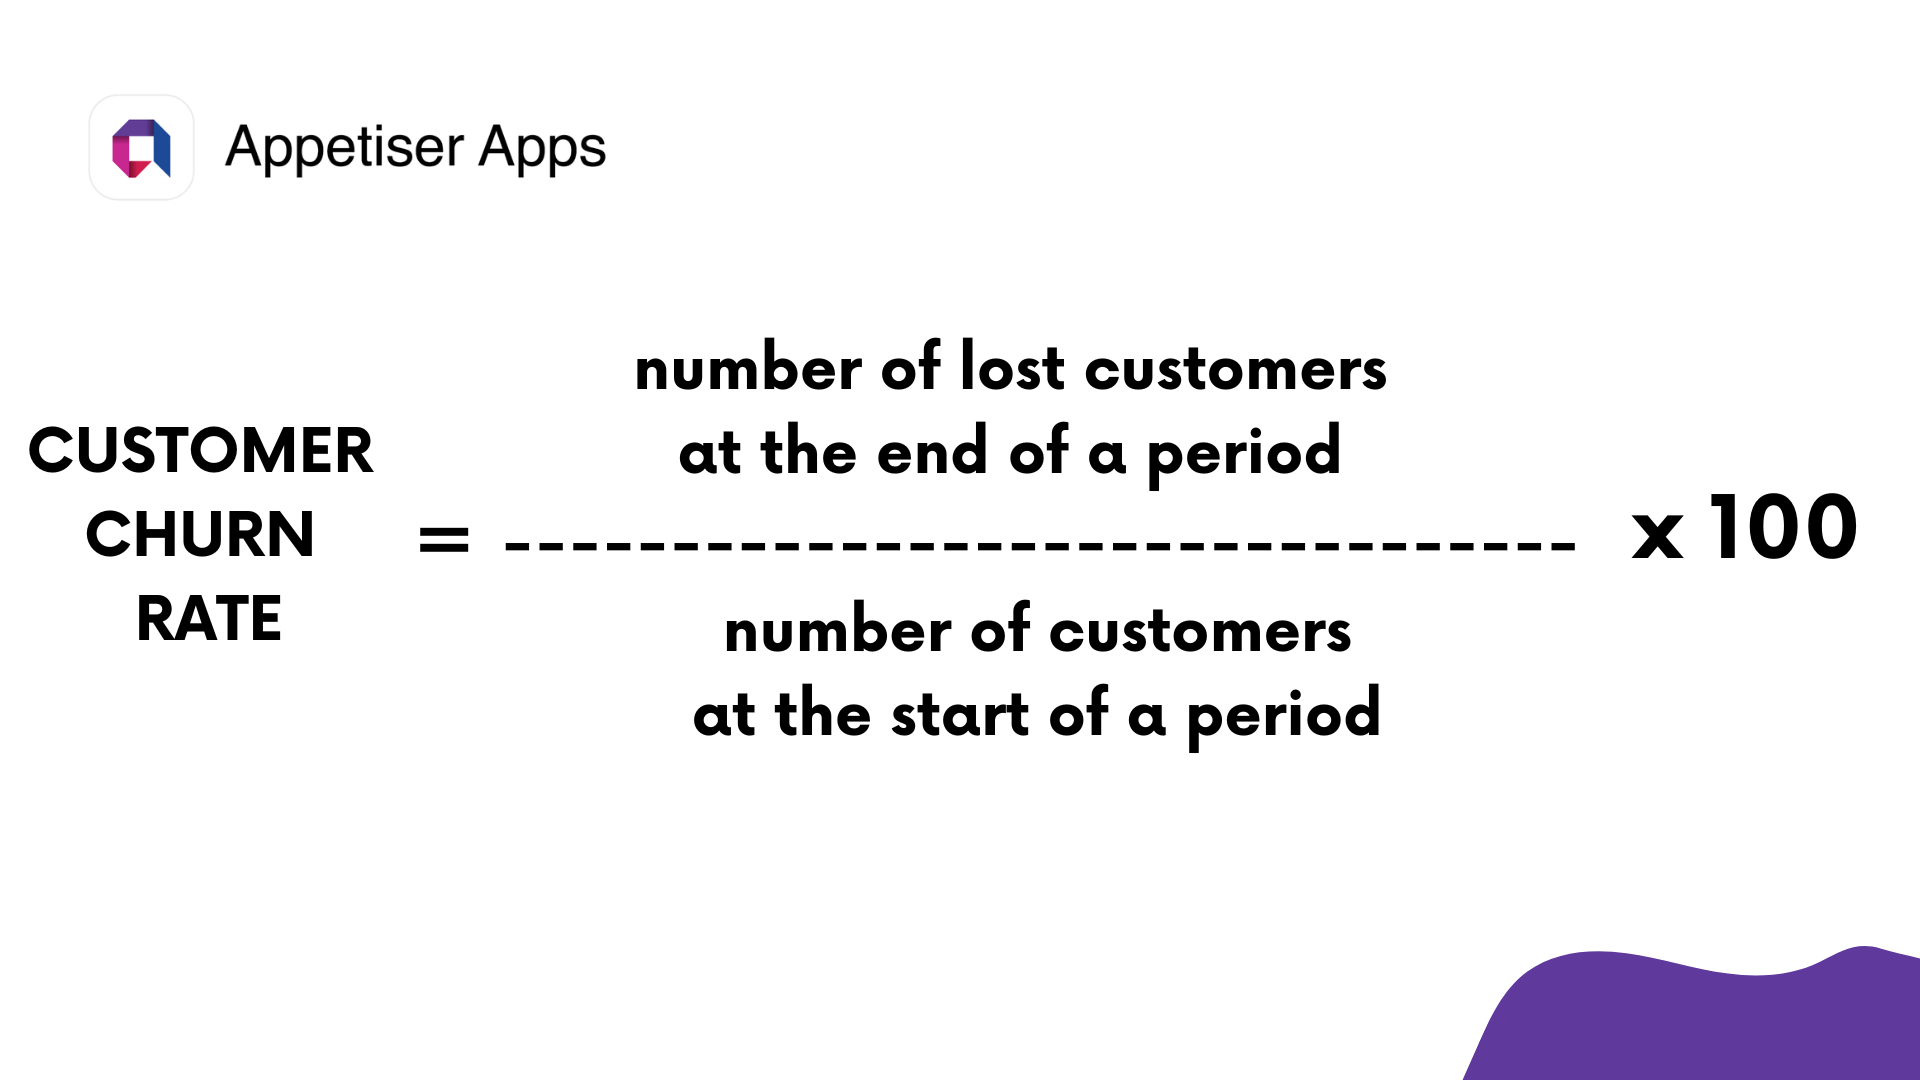
To calculate customer churn rate, divide the number of lost customers at the end of a period by the total number of customers at the start of the same period, then multiply the result by 100 to get a percentage value.
For revenue churn rate, divide the revenue lost from customers who dropped out at the end of a period by the total revenue at the beginning of the same period. After you get the result, multiply that by 100 to get a percentage.
Understanding both types of churn is vital because losing a few high-paying customers might impact revenue more significantly than losing several low-paying ones. And if you’re losing high-paying customers, you should dig deeper into why that’s happening to improve how you do business.
Net Promoter Score (NPS)
The Net Promoter Score (NPS) gauges customer satisfaction by assessing how likely they will recommend your product.
This metric is crucial in understanding how satisfied customers are with your product or brand.
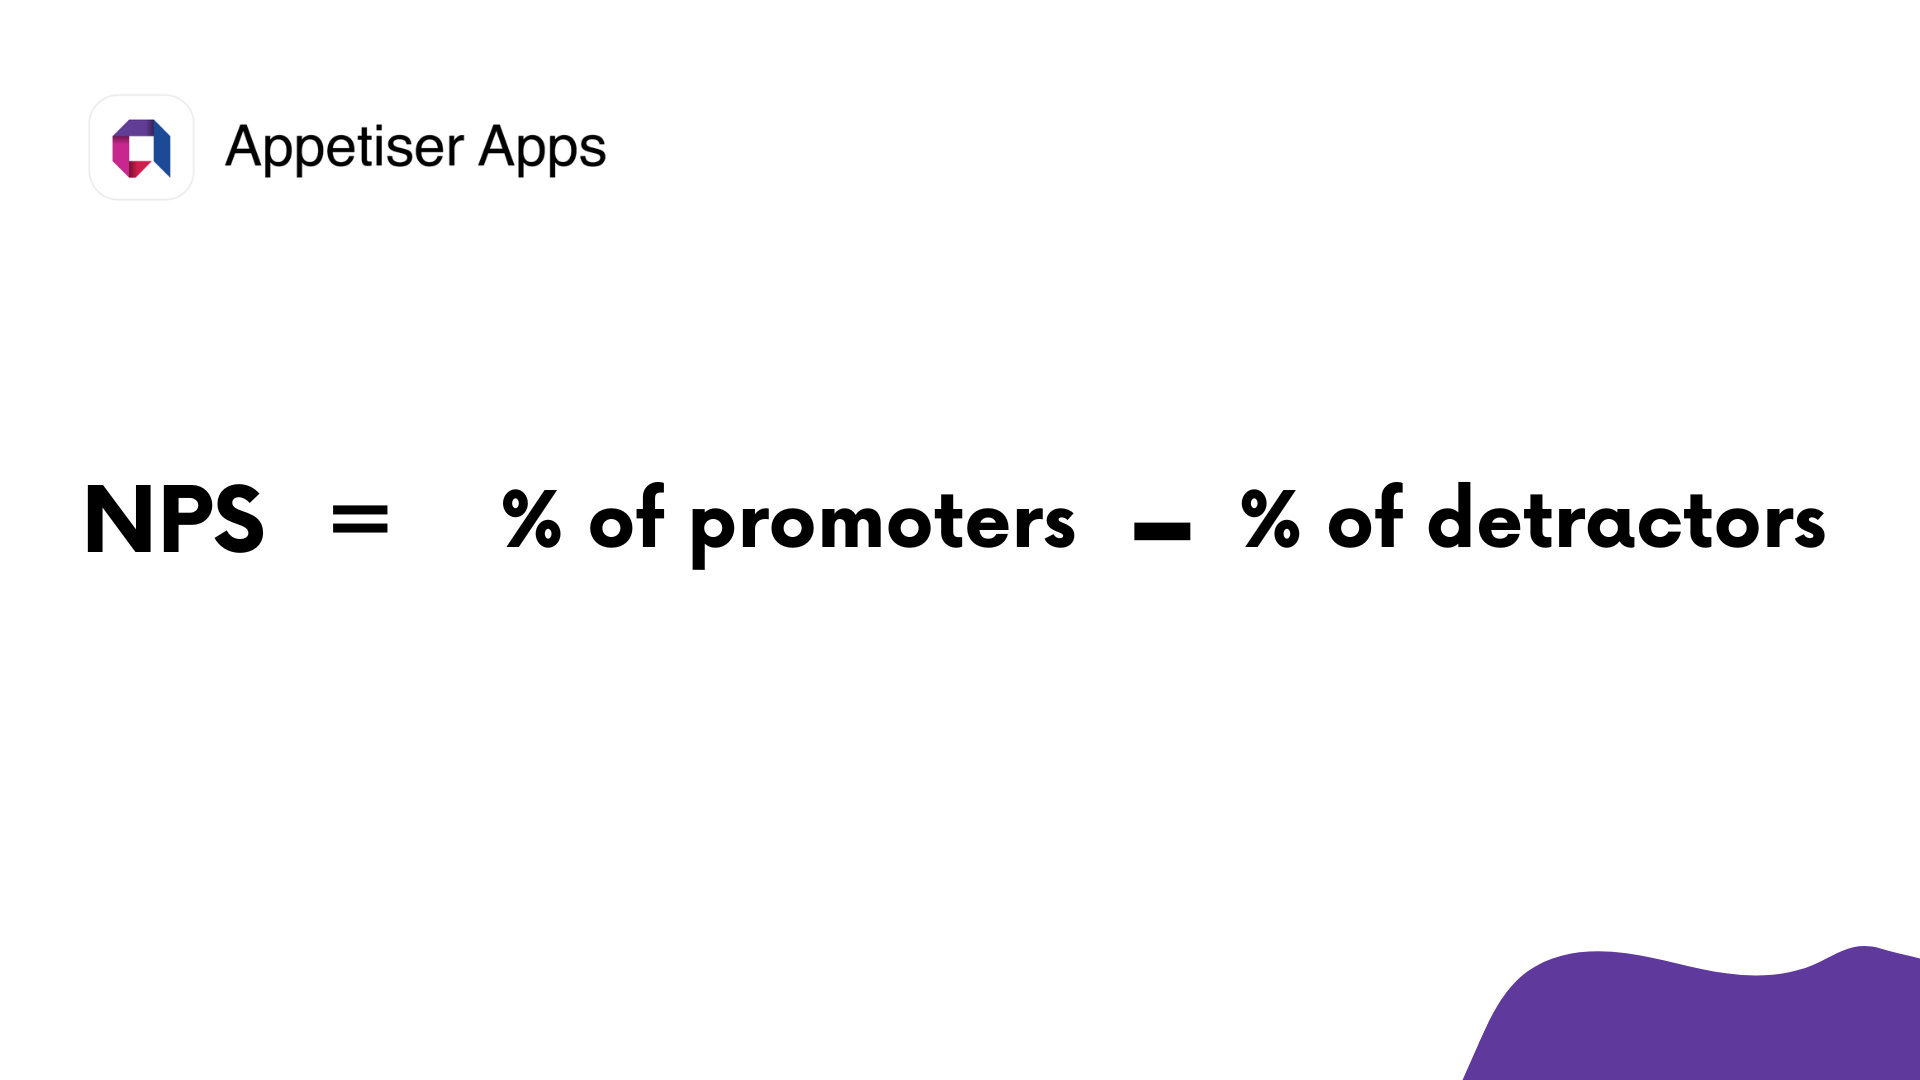
Calculating NPS involves subtracting the percentage of detractors from the percentage of promoters. To identify promoters or detractors, you can conduct an NPS survey where ratings of 9 or 10 indicate promoters (those who love your business), 0 to 6 signify detractors (those who dislike your company), and 7 or 8 represent neutrality.
Let’s say when you surveyed your store’s visitors, 50% gave your establishment a score of 9, 20% gave a rating of 6, and 30% said your store was worthy of a 7. So your NPS score is 30% (subtracting 20% from 50%). Note that you shouldn’t take into account the 30% who are neutrals.
Client Retention Rate (CRR)
The customer retention rate serves as a gauge of your product’s effectiveness in maintaining customer engagement over time. It provides valuable insights into your market presence and the strength of your product offering.
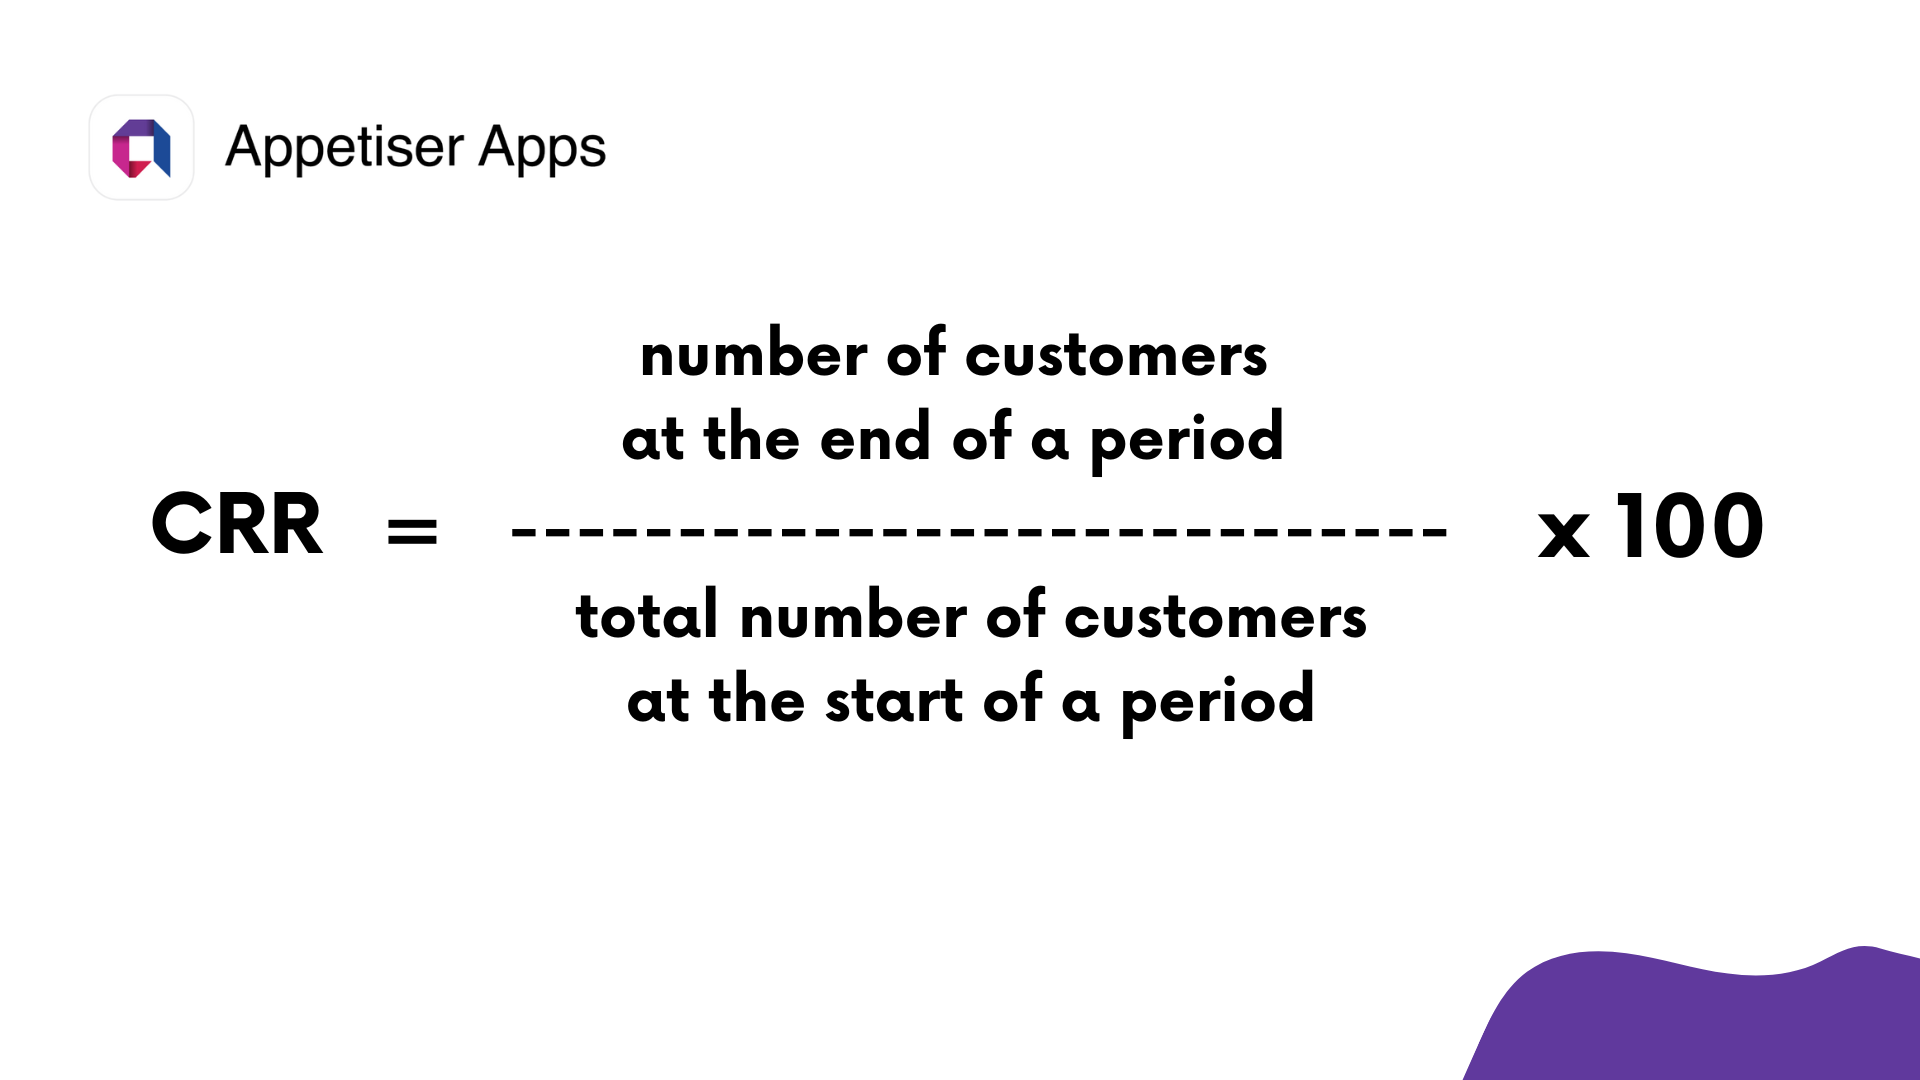
To calculate it, divide the number of existing customers at the end of a period by the total customers at the start of that period. Then multiply that number by 100 to get a percentage value.
For example, let’s assume that from January 1-31, your barber shop tallied 300 customers. But a new barber shop opened near your area on February 5. That’s why for the whole month of February, you only had 200 customers.
The start of the period here is January 31. The end of the period is the last day of February. To get the CRR, divide 200 by 300 and you get 0.667. Multiply that by 100 and you have a CRR of 66.7%.
Extremely low retention rates could mean that your product or service (or certain features of it) don’t match what customers want. Conversely, a high CRR means that the need to improve your business processes could be minimal. A good CRR could also mean more savings for your business since retaining existing customers is generally more cost-effective than acquiring new ones.
What you can measure, you can master
Mastering how to measure product success is the first important step in building an effective business strategy.
As you may have noticed throughout the article, the use of metrics helps with data collection. And harnessing data to enhance business operations is something successful companies like Spotify and Tesla have done. So if you follow their example, you’re in good company.
The interesting thing about businesses is that the more you digitize them, the more extensive and precise your data collection can be. For instance, if you have a physical store, it’s not as easy to survey customers. Now, if you make your store available to mobile users through e-commerce app development, creating and sending feedback forms to customers is just a few taps away.
But more than the better metrics, app design and development opens doors that can help you gain mastery over your competitors in many other aspects of business.
How do you measure your odds of success once you invest in mobile or web app development? Book a free consultation with us and let’s discuss your potential opportunities and outcomes.

Jesus Carmelo Arguelles, aka Mel, is a Content Marketing Specialist by profession. Though he holds a bachelor’s degree in business administration, he also took courses in fields like computer troubleshooting and data analytics. He also has a wealth of experience in content writing, marketing, education, and customer support.