The app market is rapidly becoming a crowded and competitive landscape.
With attention spans shrinking all the time, it’s harder than ever to get users to engage with your mobile app.
The best way to increase retention is to first know what users do inside an app.
This is where mobile app analytics can really pull back the curtain and provide valuable insights necessary to improve an app’s retention and growth.
What Are App Analytic Tools?
App Analytic tools record data related to how users interact and engage within a mobile application. By analysing metrics such as downloads, sessions, active users and devices, educated changes can be executed to improve the retention of an app.
The most commonly recorded analytic metrics include downloads, session times, and the number of daily and monthly users.
But, many apps require unique metrics related to unique functions or activities.
For example, an app like Airbnb (which helps users find accommodation) should track the duration of time it takes for users to complete their first booking.
Having this data readily available can allow a developer to make informed decisions to change or amend an app’s user experience in a way that is likely to improve an app’s performance and growth.
Researching app analytic tools can be a time-consuming activity. There are hundreds of tools currently available. So which one do you choose?
In this article, we’re going to break down the best app analytic tools currently available.
But first, let’s take a brief look at some of the different analytics to track and elaborate further on the importance of recording them.
Do You Really Need to Track App Analytics?
The Apple Store and Google Play Store witnessed a 35% rise in revenue in 2017.
With this trend showing no sign of slowing down, it’s worth making all the effort you can to get your slice of mobile app pie.
Whether you are creating an app for Android, iOS, or multiple platforms, the need for app analytics doesn’t change. Without access to data, an app developer simply doesn’t know how users are interacting within their application.
Essentially, without analytics, an app developer is operating and allocating resources blindly.
To run a successful app business you need to know how to improve your users’ experience from the initial onboarding sequence right through to activation, monetization, and finally, referral.
An app’s success can be significantly affected if it fails to please users at just one of these stages.
Using the metrics collected from app analytics tools will help you streamline your app and provide a higher level of customer satisfaction. You can monitor exactly where users are dropping off from your app when they’re most engaged and therefore likely to pay for premium features.
The Three Types of Mobile App Analytics
Not all mobile app analytics tools measure the same data.
The requirements of your app will determine the metrics and tools that fit the best.
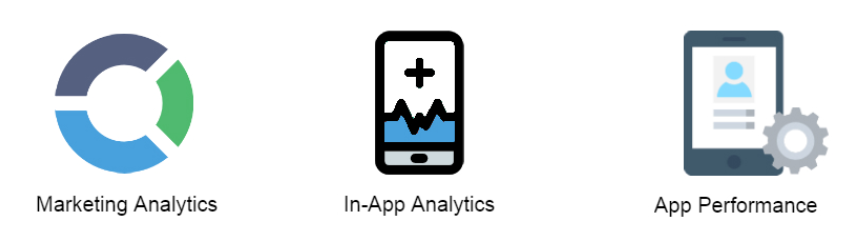
App analytic’s can be broken up into three primary categories; mobile app marketing, mobile app performance and in-app analytics.
-

Analytical tools can be broken down into three macro categories. Source: businessofapps.com
Mobile App Marketing Analytics:
It’s important to remember that almost all large businesses now have an app.
Even 20% of small businesses have an app too, so it’s increasingly difficult to stand out among the 2.1+ million apps currently available.
It’s not enough to merely create an app anymore. If you want to truly succeed, you need to market it effectively.
Mobile app marketing analytic tools examine the data relating to events like where your users find and download your app, the characteristics of these users and the amount of money they spend within your app.
Analysing these events can help an app developer perfect an app’s monetisation strategy, attract quality users and increase the return on investment.
Common Mobile App Marketing Metrics Include:
📱 CPM (cost per mille):
CPM is used to calculate the cost of 1,000 ad impressions. This is the most commonly used metric to price web ads.
📱 Click Through Rate:
CTR is a percentage calculated from the number of users who click through to an app or landing page from marketing collateral. A high or low CTR helps to determine whether marketing collateral is effective or not.
📱 Traffic Source:
This metric tracks how users find an app. Marketers use this metric to determine which marketing strategy is performing the best.
📱 Number of Downloads:
The simplest way of tracking the success of a marketing campaign is to track the number of app downloads.
📱 User Demographics:
Understanding the psycho-graphics of app users is extremely useful for targeting the right users and improving the return on investment on marketing expenditure.
📱 Cost Per Install:
Cost per install is calculated by dividing the total marketing expenditure by the total app installs gained. According to data from February 2017, the global average cost per install for iO apps was $0.44 and $0.86 for Android apps.
📱 Devices:
The devices that the majority of downloads are coming from. Are they via Android, iOS, Blackberry or tablets? These findings can be useful for improved targeting of an app’s customer base and planning future iterations.
📱 Free to Paid Conversion Percentage:
The percentage of users who convert from free to paid users. For example, Slack converts an impressive 30% of customers from a free to a paid subscription.
📱 Purchase Time Frame:
This refers to the duration of time it takes to convert users into paying customers. This is particularly helpful when an app is frequently used but the conversion percentage is particularly low. Using this data can assist in strategically placing calls to actions, promotions and special offers to increase conversions.
📱 App Rating:
A rating out of five stars on the Apple App Store and Google Play Store. A high rating provides the social proof necessary for potential users to consider downloading an app.
📱 App Review:
Users can leave a review of an app after downloading it. App reviews provide qualitative recounts of user experiences, suggestions and problems. Most app users read reviews before deciding to download an app.
📱 Social Shares:
This metric records the number of times your app is shared across social media sites. Typically, the more shares on social media, the more opportunities to organically acquire more users.

Paying attention to all of these metrics can be time-consuming, but it’s imperative to track to achieve long-term success.
At the end of the day, finding the top performing marketing campaigns is a mix of strategic research, creativity and experimentation.
Marketing shouldn’t be an activity you do in the dark either.
If you throw a dart in the dark and it hits your target, how do you know where to throw the next one? And the next one after that?
Recording these marketing metrics will show you where to throw the dart next through data-backed insights.
Do you need some help crafting your app marketing campaigns? Take a look at our article on the 11 Most Powerful App Marketing Strategies To Drive Installs here!
Mobile App Performance Analytics:
Mobile App Performance metrics delve into the robustness of an app.
These metrics are purely focused on how the machine itself is actually running. It’s not concerned with the acquisition and behaviour of the user or the profitability of the business.
Mobile performance analytics purely identify areas within an app which frequently crash, the devices that struggle to run the app and the overall reliability of its servers and code base.
Although these metrics are a little boring, it’s important to track them so actions can be made to keep users happy and engaged. After all, if your app crashes every time it’s opened on a Samsung Galaxy Note, no marketing collateral in the world will convince Samsung users not to uninstall your app.
By tracking the following analytics you can fix the bugs that can stand in the way of your app’s success:
📱 Real-time Alerts:
This notifies the developer every time an app is offline. With this alert, an app developer can take the necessary steps to fix problems that occur as quickly as possible. Users are quick to uninstall an app if it is constantly unresponsive. Any issues need to be fixed immediately.
📱 Crashes/Errors:
The amount of times an app experiences a major error that causes the service to become unavailable. A good app developer aims to minimize app crashes with stable code. Recording crashes will, therefore, help developers identify the actions that cause apps to mysteriously crash. The more data the developer has on bugs and crashes, the higher the likelihood of ironing it out completely. Crashes frustrate users and will inspire them to uninstall apps.
📱 Exceptions:
These are essentially safety nets for errors. If an error occurs, an exception will be triggered which will attempt to fix the issue. But if it’s unsuccessful the entire app will shut down. Tracking the success and failure rate of exceptions allows developers to improve exceptions so that the app crashes less frequently.
📱 Carrier Latency:
Latency refers to the amount of time it takes for the data to be sent from the sender (internet service provider) to the recipient (mobile device). If the latency speed is too slow, your developer might need to look at how they can improve this. After all, people don’t like to wait!
📱 Uptime:
Uptime is the amount of time an app is performing at 100% functionality. Ideally, an app developer wants this percentage to be as close to 100% as possible. If uptime figures are low, it’s sensible to place more resources into fixing the issues causing downtime.
📱 API Latency:
Application programming interfaces (API’s) are basically the building blocks of computer programs which include communication protocols, subroutine definitions, among other aspects. Mobile app developers use APIs to speed up the app-building process as they can weave together functionalities rather than building the entire app from scratch. This dramatically reduces time and cost. Whether an app uses one API or dozens, they should be tracked to ensure acceptable latency.

Tracking mobile app performance metrics can be a little dull, but it’s an action that must be taken to avoid losing customers to crashes, bugs and slow performance.
It’s important to note that there is a high amount of apps on the market who are competing for your users; if you can’t offer users a reliable and robust experience, somebody else will.
In-App Analytics:
In-app analytics track the behaviour of users inside a mobile application.
With in-app analytic tools, an app developer can track the average usage duration, popular features, common pathways (travelling from one screen to another) and much more.
These metrics can illustrate common drop off points, unused features and unusual pathways that can be corrected or improved to increase user retention.
As of June 2018, the average uninstall rate was 28% after 30 days.
This is quite an intimidating figure.
In-App analytic tools are a developer’s front-line defence against high uninstall rates.
Additionally, to further develop an app business, in-app analytics are important to determine which features resources should be allocated to. It’s unwise to allocate thousands of dollars of work into an unwanted or unused feature.
The following in-app metrics will help you to increase app retention:
📱 Device:
Are users opening the app on iPhones, Samsungs, Blackberry devices, or tablets? If the data shows the majority of users have HTC phones, it’s a smart move to prioritize compatibility with that specific device.
📱 Operating System:
Similarly, which operating system are they using? Is it iOS or Android devices, or an alternative? This metric is useful for prioritizing future development budgets.
📱 Pathways:
How are users navigate through the app? This metric tracks where app users are clicking, scrolling and the tasks they complete. Patterns can be found by collecting as much data as possible and analysing it to understand what is most important to users.
📱 Location:
Demographics on where the users are based. This is important to optimize marketing expenditure, but also to create region specific information and functionality.
📱 Time of Use:
The time of day, week or month your application is most regularly used. This helps the app developer determine the ideal times to create push notifications to increase user retention or to create time specific features such as night mode.
📱 Session Duration:
How long the user engages with an app in a single session. If an app’s users are using the app for 30 seconds before uninstalling the application, it’s worth considering adding or strengthening the on-boarding process.
📱 Most Used Screens:
Knowing which screens users constantly return to is powerful information to have. If a feature or function is most used, it may be worthwhile to reduce the number of screens required to arrive to that feature. This can improve the overall user experience and retention.
📱 App Closes:
Finally, it’s important to know when users are closing an app. Common patterns provide insight into the events that cause users to become bored, frustrated or give up on a product. These events can then be counteracted with optimized navigation, tutorials or even new features.
The aim of in-app metrics is to create and facilitate long-lasting relationships with users. Ultimately, it’s a waste of money to acquire users when the actual mobile application fails to deliver the promised functionality and value.
Using in-app analytic tools can assist a talented analyst to recognize patterns in the user data and then determine the ways to optimize to increase user retention.
The Best Mobile App Analytics Tools
We have compiled a list of the best mobile app analytic tools below.
Each tool has it’s own unique features and attributes, so be sure to read through the key features for each tool – none are quite the same!
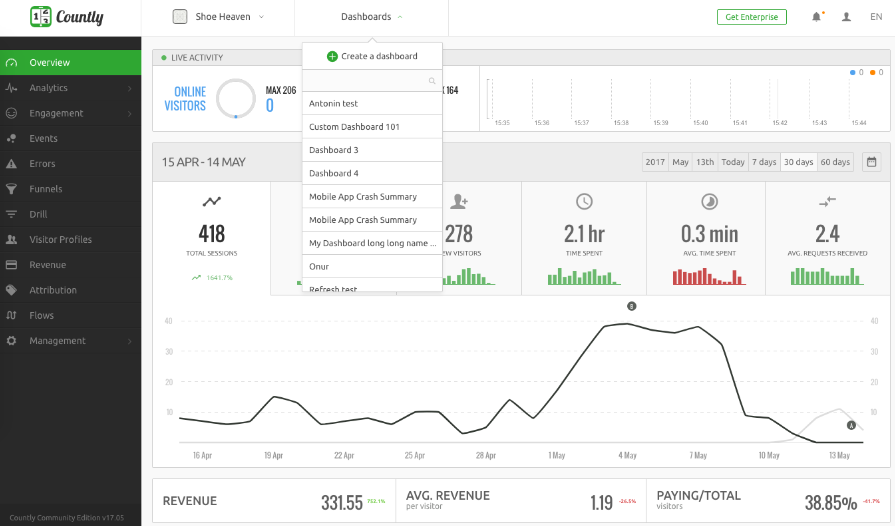
Countly
Countly describes itself as the best analytics platform to understand and enhance customer journeys. Used by the likes of Microsoft and Verizon, it’s a fantastic real-time, open source tool which will drill down into your mobile analytics and marketing platform.
Key features:
🔔 Increase loyalty and engagement with push notifications.
🔔 Track by session frequency, custom events, geography, devices, and individual users.
🔔 Record crash reporting for all mobile platforms.
🔔 Drill deep into data without running any fancy SQL queries.
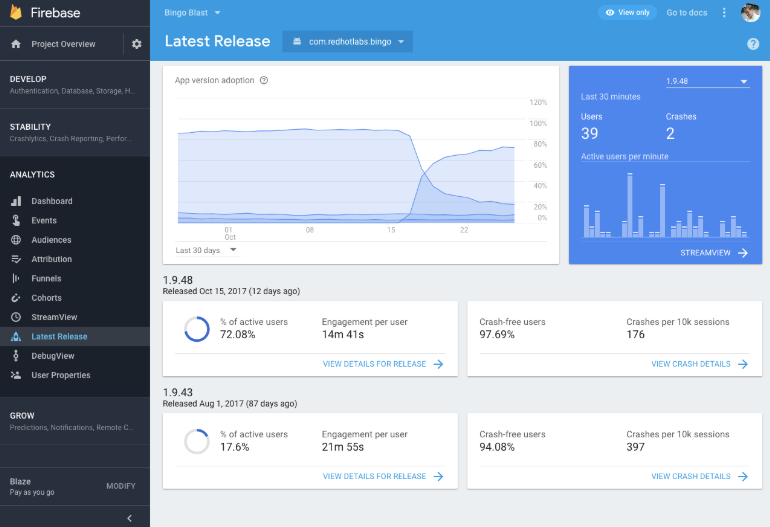
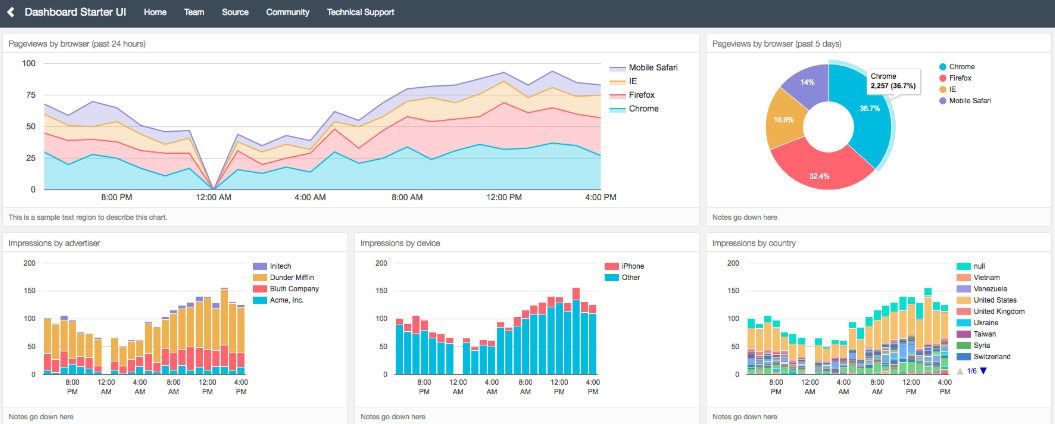
Firebase
Firebase is a Google-acquired tool that delivers comprehensive app analytics as well as a growth platform. This free service gives you a huge range of analytical insight without any troublesome sampling, quotas, or paid tiers.
Use Firebase to:
🔔 Receive reporting on up to 500 events.
🔔 Discover popular features that engage users and find out which push notifications are working.
🔔 Integrate your data with BigQuery to run your own analysis and create custom dashboards.
🔔 Use the Firebase SDK to gain insight into events, user properties, and more.
-

Visualize your data exactly how you want to. Source: firebase.googleblog.com
-

Firebase has acquired Crashlytics. Source: firebase.google.com
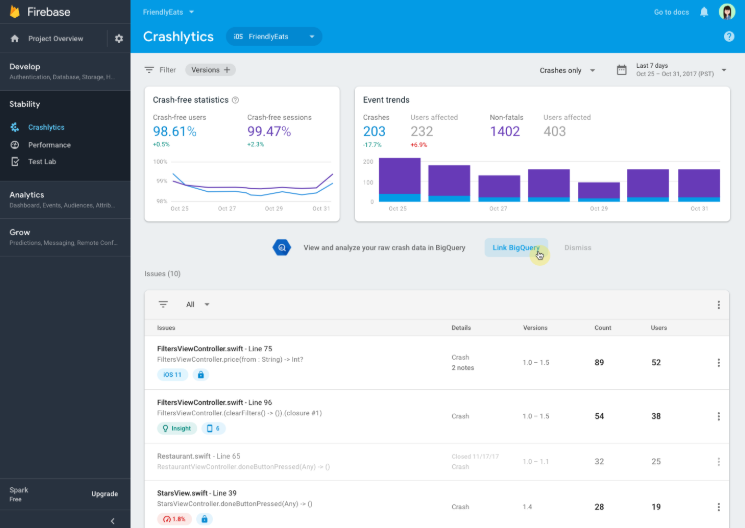
Firebase leverages Crashlytics abilities to:
🔔 Show you exactly which line of code your app crashed on.
🔔 Improve growth and retention by providing a better user journey.
🔔 Provide clear and concise analytics that don’t take too much time to analyze.
It’s also worth noting that Firebase will also absorb Fabric in mid-2020 to create an even more analytic powerful tool.
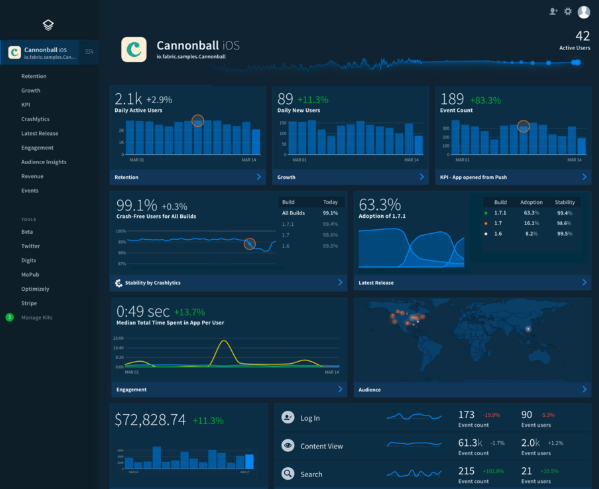
Fabric
Fabric was originally built by Twitter and then acquired by Google. Fabric is a comprehensive suite of developer tools designed for demographic understanding and mobile app growth.
Using Fabric can:
🔔 Provide real-time data on crash reporting and analytics.
🔔 Give you alerts on app issues which can affect the user experience.
🔔 Track active users and gather insight in any way you want.
🔔 Use live social content that can boost your user engagement.
Fabric is free to start with, so is worth a try to see if it works for your business.
-

Fabric helps mobile teams understand users and develop better apps. Source: fabric.io
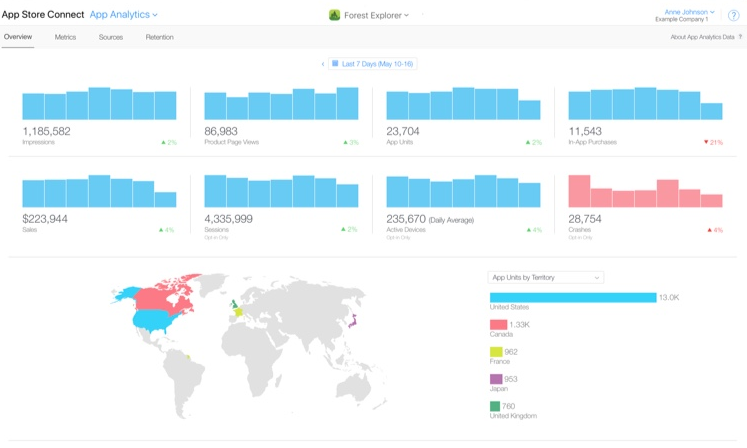
Apple App Analytics
Apple’s analytics tool provides information on app trends and financial performance.
Being an Apple product, Apple App Analytics can give you exclusive data on your iOS and tvOS apps which no third party tool can deliver. A huge perk of this tool is that it tracks and counts users by Apple ID instead of by device type or other assigned IDs. Therefore, user data is incredibly precise.
In addition, once you’ve created a developer account you can:
🔔 Discover the marketing channels that have the highest impact.
🔔 See how many times your app’s icon has been viewed on the App Store.
🔔 Calculate the effectiveness of your App Store product page.
🔔 Track crashes and bugs by OS, platform, and app version.
-

Apple App Analytics should be your go-to tool for iOS apps. Source: apple.com
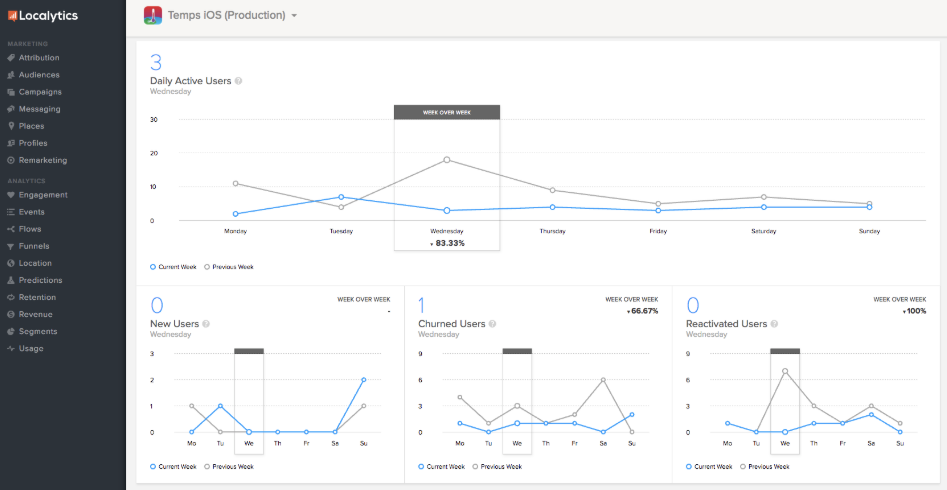
Localytics
Localytics is one of the best tools for understanding your target audience.
The tool offers comprehensive data on app sessions and usage. Localytics will enable you to dig deep into the users who are using your product. It also gives you industry benchmarking so you can see how your app is performing against the competition.
Use Localytics to:
🔔 Discover detailed data on app users.
🔔 Track conversion rates and frequency of sessions.
🔔 Create targeted messaging based on cross-data connections.
🔔 Increase customer retention by improving engagement.
-

Localytics uses raw, real-time data to run customer analysis. Source: localytics.com
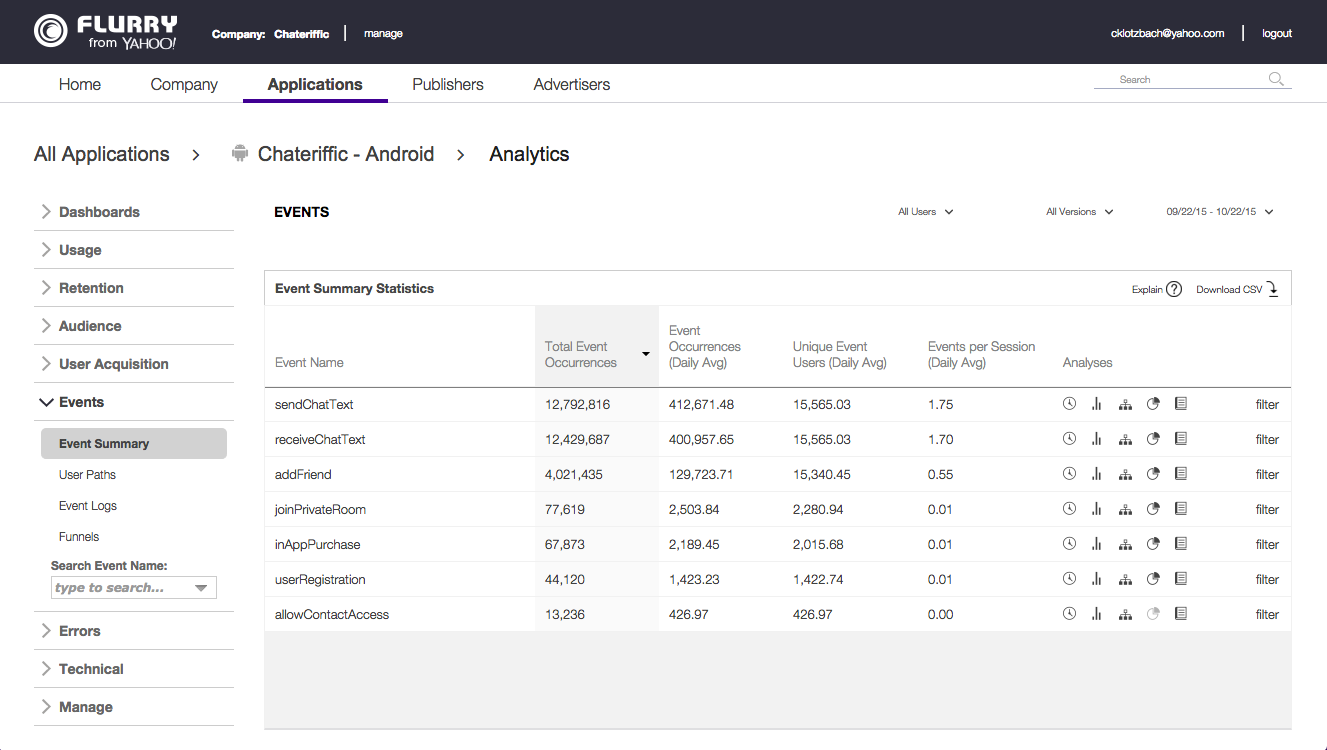
Flurry Analytics
Flurry Analytics is a Yahoo-based tool that allows you to measure user activity in your app for free.
This tool is especially handy for developers with more than one app, as you can track multiple products across both iOS and Android platforms to see how they’re doing in comparison to one another.
Other features include:
🔔 Tracking in-app actions and usage trends.
🔔 Splitting users by app version, usage, install data and other data points.
🔔 Calculate bounce rates and churn rates.
🔔 Create push notifications based on relevant data.
-

Flurry is free to use and gives great insight into user activity. Source: flurry.com
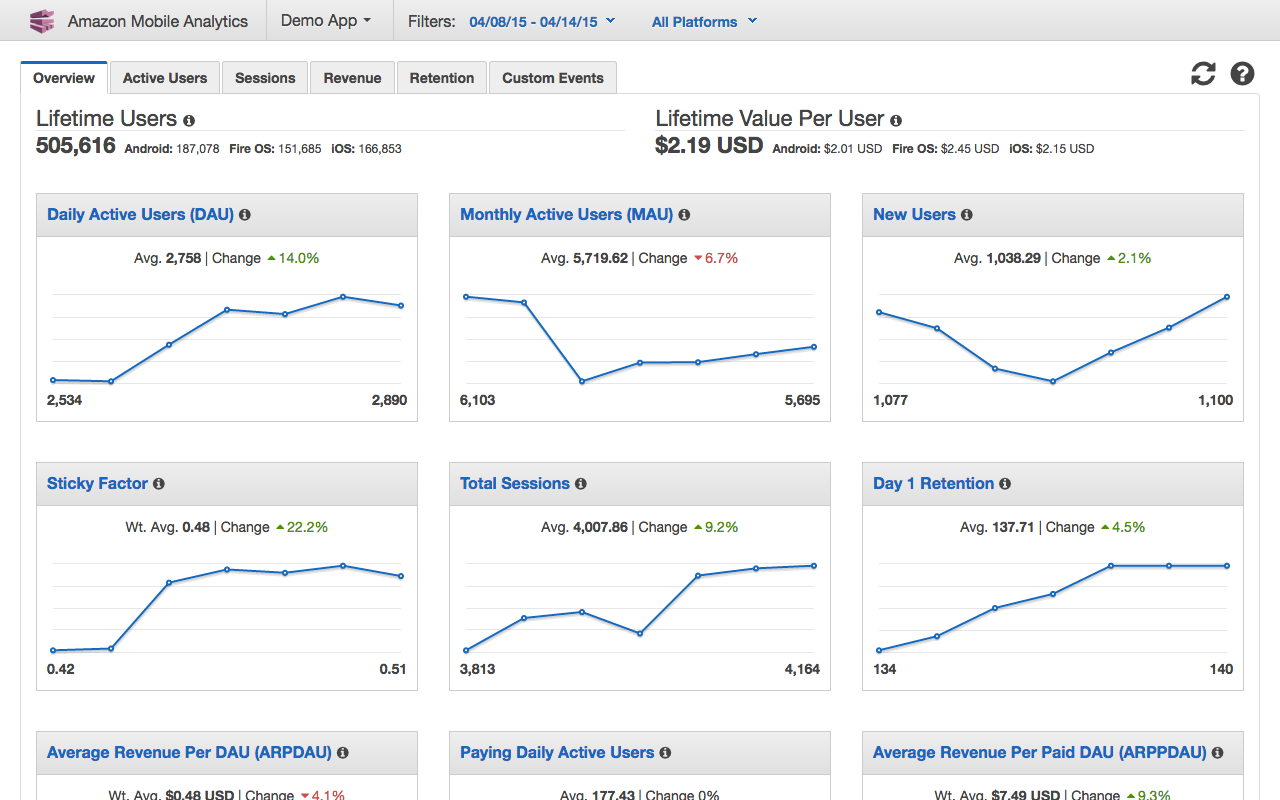
Amazon Pinpoint
Amazon Mobile Analytics and Amazon Pinpoint were once separate tools.
Thankfully, they are now one super-tool that allows developers to measure app usage and revenue, as well as data to compare new and returning customers.
Key features include:
🔔 Collect user information and run campaigns to improve user engagement.
🔔 Communicate with global customers in over 200 countries around the world.
🔔 Export raw data into Amazon S3 and Amazon Redshift for analysis.
Amazon Pinpoint’s most basic package can be used for free and covers up to 100 million app events per month. This version also allows you to target 1,000 customers and send 1 million push notifications.
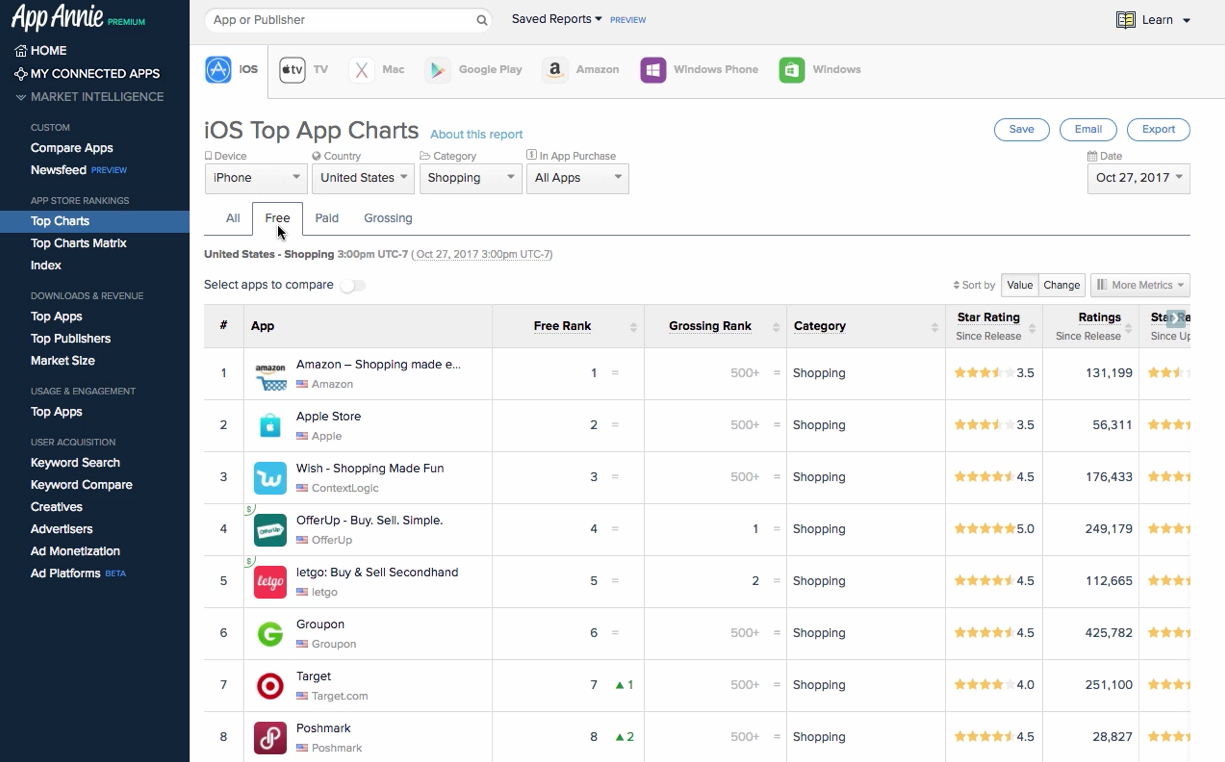
App Annie
App Annie is a super tool for tracking app performance based on usage, revenue, downloads, and spending.
Data is broken down between countries and app stores, and best of all, it’s all for free. App Annie works across all major mobile operating systems and you can access reports via their web
dashboard, apps, emails, and CSV reports.
Other trackable metrics and tools include:
🔔 Ad campaign performance based on ROI, CPI, and the total active installs.
🔔 Support with your localization strategy via geographical user information.
🔔 The impact that app updates have had on downloads and usage.
-

App Annie is comprehensive, easy to use, and best of all is free. Source: appannie.com
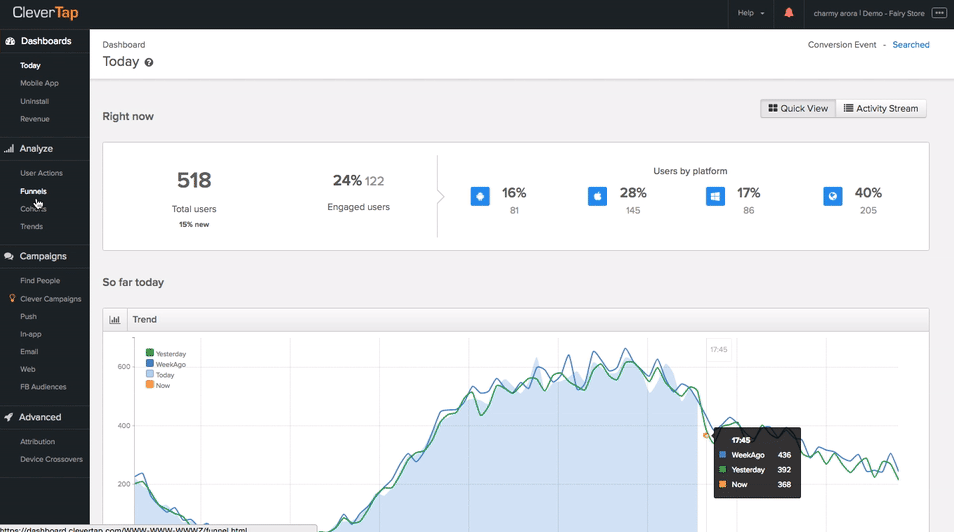
CleverTap
CleverTap is a great tool for marketers who are looking to create powerful engagement strategies.
One of its key features is the impressive suite of segmentation tools. You can assign multiple segments and set triggers to have them move to other segments based on behavioural conditions of your choosing. This gives a dynamic representation of your audience that is invaluable to marketers.
You can do lots with CleverTap including:
🔔 Find out how many people are using an app in real time.
🔔 Determine how many users are new and how many are returning.
🔔 Trigger push notifications and emails to improve engagement.
🔔 Set up funnels and custom events to track in-app user behaviour.
CleverTap offers a free trial, so it’s definitely worth giving it a go.
-

CleverTap is used by the likes of Sony, Vodafone, and Domino’s. Source: clevertap.com
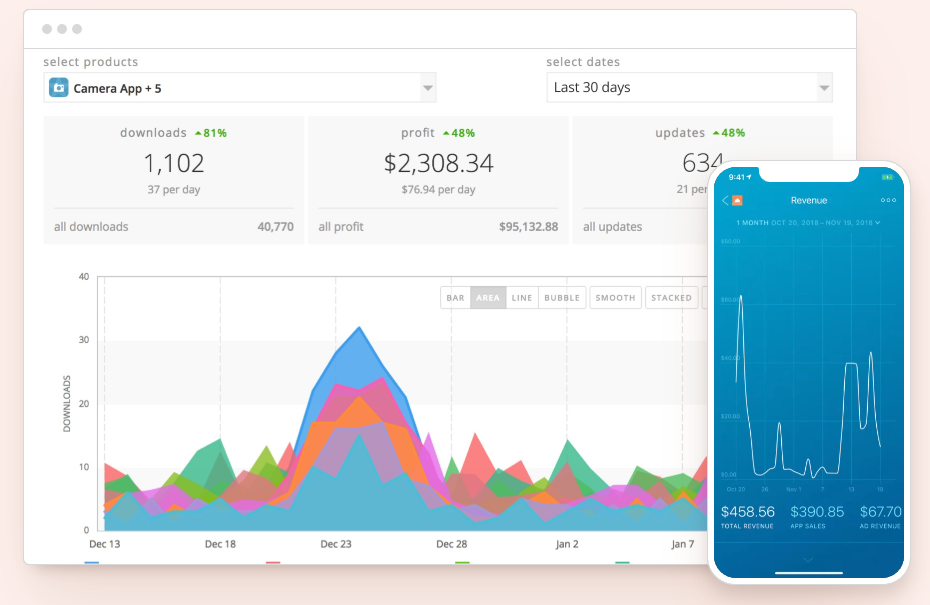
Appfigures
Appfigures is a popular tool businesses like Slack and Snapchat trust, and with good reason. It’s excellent for monitoring and optimizing downloads and revenue. This tool is easy to set up and the real-time alert functionality makes it effortless to keep track of app performance.
Features include:
🔔 View hourly rankings to keep on top of app performance against the competition.
🔔 Read and reply to App Store reviews.
🔔 Easily create flexible reports that let you hone in on the numbers you need.
-

Appfigures is a great tool for creating complex reports with minimal efforts. Source:appfigures.com
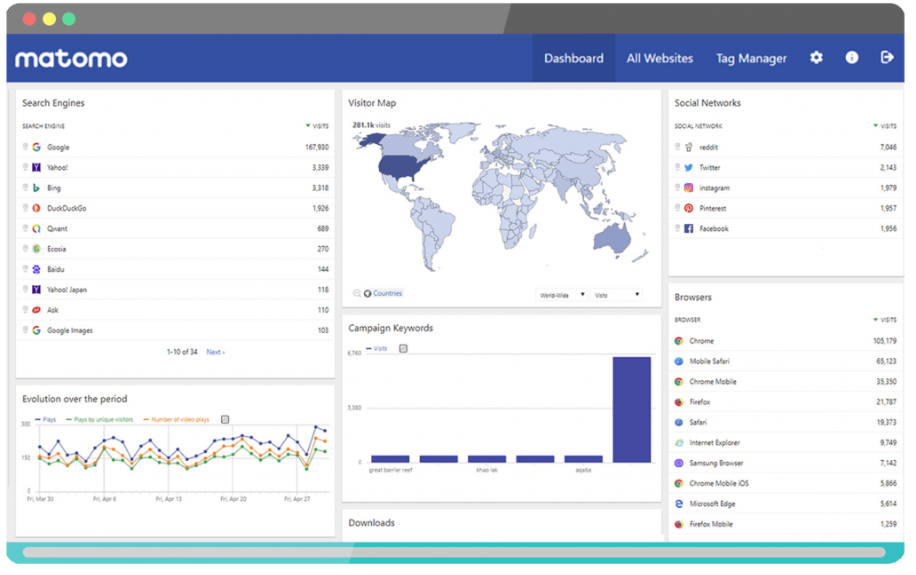
Matomo
Matomo is another free tool with great customization options.
This open source tool is attractive because it allows developers to keep user data private instead of channelling it through third-party services. Although it can take some time to master Matomo, it’s worth the effort, and once you’re up and running there’s a lot that you can do with it. It can be hosted on your own infrastructure or in the tool’s cloud and offers SDKs for Android, iOS, and Titanium.
Here’s what you can do with Matomo:
🔔 Track user numbers, demographics, and device information.
🔔 Monitor the performance of an app, including errors and loading times.
🔔 Analyze the user experience and optimize each step of their journey.
🔔 Drive your SEO strategy with search engine referrer metrics.
-

Matomo users include NASA, Huawei, and Nintendo. Source: matomo.org
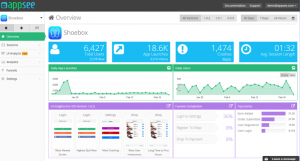
Appsee
Appsee is a superb qualitative app analytics platform offering tools such as heat mapping and user recordings.
It’s one of the best options available to get an in-depth analysis of user behaviour, giving you the tools you need to improve the customer journey through your app.
The benefits of Appsee include:
🔔 Observe user actions to understand exactly how they interact with your product.
🔔 Track gestures with heatmaps to see which navigation and interaction tools are used the most.
🔔 Receive real-time video reports on app crashes to help fix them quickly.
🔔 Pre-define events and receive insightful analytics.

- Receive detailed reports on app behaviour. Source: appsee.com
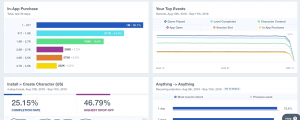
Mixpanel
Mixpanel can be used by mobile app developers to gather events-based analytics. It’s simple to use: just install their SDK and start creating custom events to track within your app.
With Mixpanel you can do the following:
🔔 Look into the user demographics of the people downloading your app.
🔔 Discover why people are uninstalling or abandoning it.
🔔 Use push notifications and emails to engage with customers.
🔔 Run A/B testing on your messages.

- Track customers, revenue, and more. Source: mixpanel.com
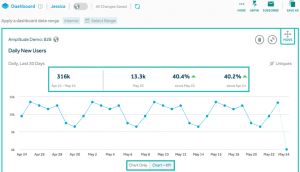
Amplitude
Amplitude is the tool you need if you want to discover what makes your users tick.
It’s designed to help you release better products that will help you grow your audience and your business, and is trusted by the likes of PayPal and Capital One.
Growth is the name of the game with Amplitude, and you can:
🔔 Track product data and use behavioural reporting to see why users return to your app.
🔔 Find out what’s not working so you can eliminate issues and improve retention.
🔔 Increase user engagement by benchmarking the stickiness of new features against old ones.
🔔 Discover new demographics in your customer base so you can effectively target them.

- Amplitude is the industry’s first growth engine. Source: amplitude.com
Keen
Keen is all about user-facing metrics that are easy to get up and running.
With just a couple of lines of code, you can seamlessly integrate your data analytics in an attractive and simple to use interface that mirror’s your app’s look. The tool was built with developers in mind, and its focus on qualitative data can be very useful for growing an app that keeps users happy.
There’s plenty you can do with it:
🔔 Track events and see what’s working for your app (and what isn’t).
🔔 Gather real-time analytics for valuable metrics that can help you grow.
🔔 Gain actionable insight into how users behave in your app.
-

Simple integration gets you going in hours, not months. Source: keen.com
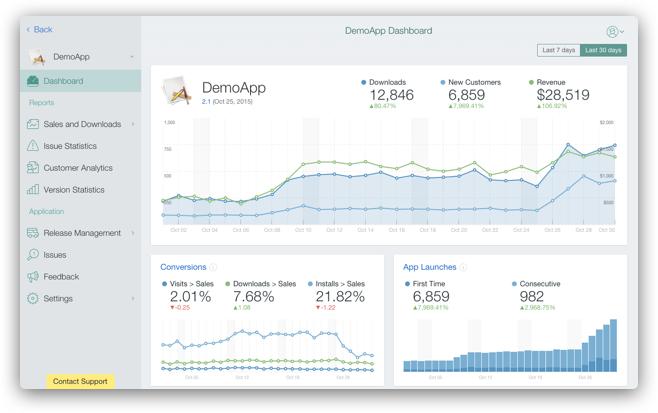
DevMate
DevMate is a comprehensive distribution and app management platform.
It gives you in-depth marketing metrics, analytics, and real-time conversion ratios that you can use to grow your app and increase retention.
It uses three main types of metrics – visits, sales and downloads – to deliver the following data:
🔔 Conversion rates among your users.
🔔 Details on which marketing campaigns are achieving the highest traffic.
🔔 Revenue reports, including any refunds.
🔔 Funnel performance so you can see which areas of your app are working hardest.
-

DevMate gives app development teams advanced marketing metrics and analysis. Source:
devmate.com
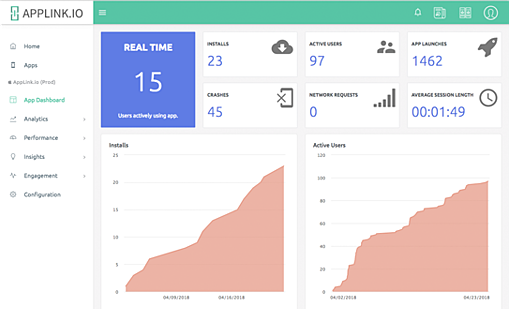
Applink
Applink touts itself as making data helpful by providing clearer insights.
Applink the only app software platform that provides insight into users and products through a combination of analytics, engagement, and performance metrics.
The aim of Applink is to:
🔔 Achieve higher engagement by creating meaningful interactions with users.
🔔 Gain clarity on your app’s performance and its user experience.
🔔 Save time by collating data and allowing fixes in the same dashboard.
🔔 Attract new users, increase retention, and drive revenue.
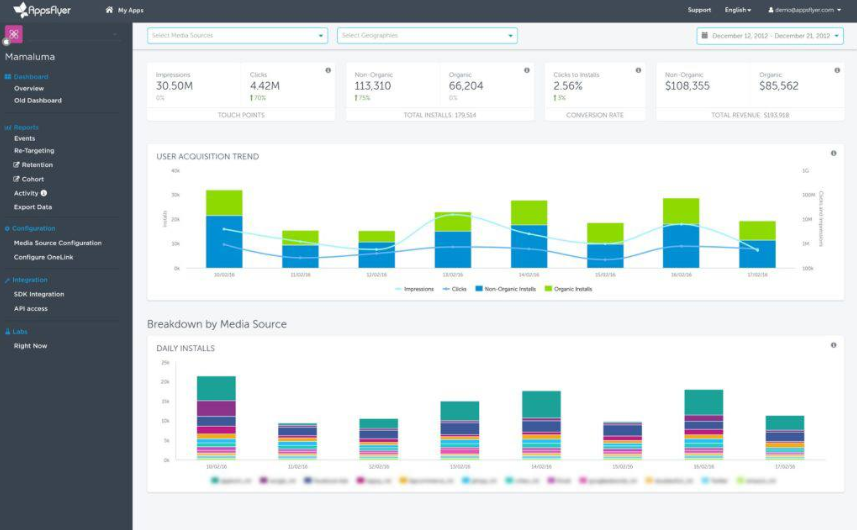
AppsFlyer
AppsFlyer allows marketers to track app installs back to each individual marketing campaign and media source that your team has utilized.
Using measurable data, AppsFlyer aims to grow your business and make the most of your marketing budget.
With AppsFlyer you can:
🔔 Review impressions and click data to see the ROI for your marketing campaigns.
🔔 Measure the impact of mobile marketing to discover the LTV of new app users on a channel by channel basis.
🔔 Collate raw data to run an offline analysis.
🔔 Get real-time reporting on marketing campaigns, so you can quickly tweak communications.
AppsFlyer offers a 30-day trial and is then priced based on a pay-per-use model.
-

AppsFlyer offers real-time reporting on a variety of metrics. Source: appsflyer.com
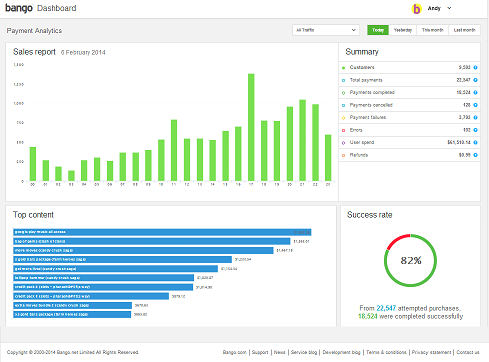
Bango
Bango is used for enabling online payments for internet giants such as Google and Amazon, as well as many other smaller mobile apps.
Their technology allows for various payment methods to be offered, ensuring that no potential customer is restricted from purchasing through your app.
The perks of Bango include:
🔔 It’s a single integration that allows for hundreds of worldwide payment providers.
🔔 Bango Grid reaches the maximum number of paying customers faster than any other method.
🔔 Bango Dashboard provides real-time insights into your customers’ spending.
-

Bango captures valuable information regarding customers and their payments. Source: bango.com
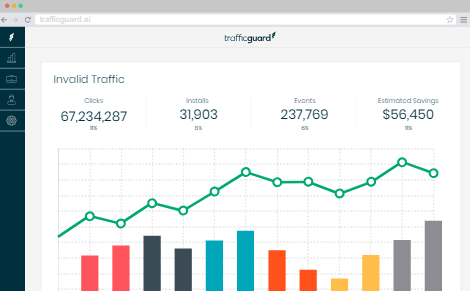
TrafficGuard
TrafficGuard serves a different purpose, in that it provides some of the best mobile ad fraud protection available.
This smart tool blocks fraud before it can hit your advertising budget. They’ve blocked over 4 billion fraudulent transactions to date which amounts to a huge sum of money saved.
Key features of TrafficGuard include:
🔔 Three-stage fraud prevention: at click, attribution, and post-attribution levels.
🔔 Non-human traffic is blocked, helping you collect authentic user data.
🔔 Fraud reports are comprehensive and easy to understand and integrate.
🔔 Manage multiple campaigns in a single portal.
-

Know exactly who’s responding to your ads by eliminating fraudulent traffic. Source: trafficguard.ai
Which App Analytic Tool Should You Use?
Unfortunately, there’s no clear-cut answer to this question.
The best app analytic tools for your business should be defined by the specific metrics you need to track.
Highly complicated apps are advised to shop around for an analytic tool that will provide a high degree of customization while testing their performance. But, a less complicated application may only need basic metrics and therefore choose an analytic tool with ease of use and an attractive user interface.
Your choice will also boil down to the budget you have to spend on the analytic tools.
Luckily many of these tools are offered with free trials or limited accounts. Take advantage of these offers and become acquainted with the user interface and functionality of each analytic tool
before you commit to purchasing.
Even with a limited budget, it’s advisable to at least set up an account to measure the generic metrics with one of the many free analytic tools listed in this article.
Thanks for reading, and good luck!\
Director & Founder. I build and grow ideas. With a heavy focus on business strategy and automation, I am focusing on the interception of technology, marketing and design.