Your Ultimate Mobile Analytics Playbook for App Success

Curious how users interact with your app?
Well, the first step to understanding where your product stands today is through mobile analytics.
The average business analyzes 37%-40% of its data, and those who leverage big data solutions increase their profits by an average of 8%.
In this mobile analytics playbook, you will learn to navigate the complexities of this area and understand the role of data analytics in your app’s success.
- What is mobile analytics?
- Why is mobile app analytics so important?
- What are the types of mobile analytics you should monitor?
- How to analyze mobile app user behavior?
- What are the steps for mobile analytics?
- What’s the difference between mobile app analytics and mobile web analytics?
What is mobile analytics?
Mobile analytics collects and analyzes data from a mobile application to understand user behavior, engagement, and demographics. Mobile analytics studies how users interact with mobile apps. Tools like crash reporting tools and feedback channels collect this data. They help developers and marketers adjust app monetization strategies and improve app engagement.
Why is mobile app analytics so important?
Mobile analytics help you make informed decisions on your post-mobile app development phase and mobile marketing efforts.
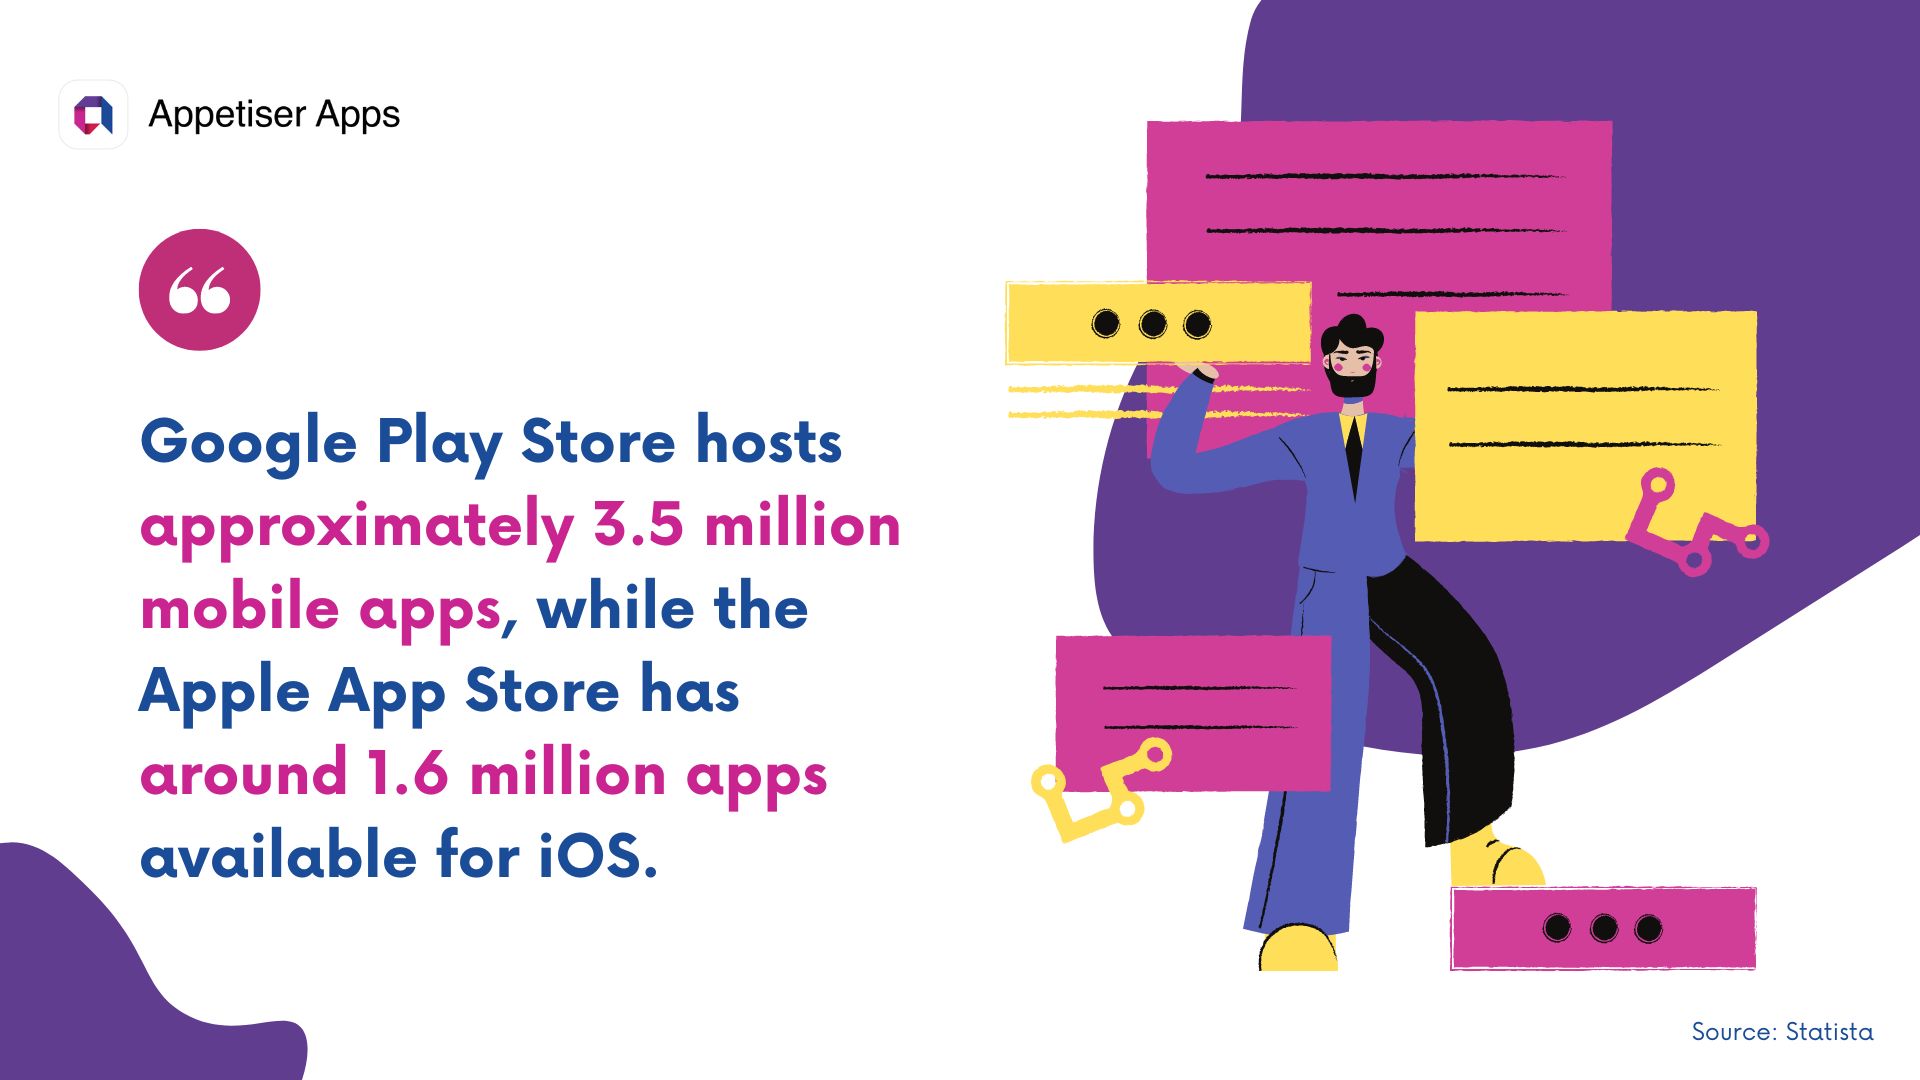
Currently, Google Play Store hosts approximately 3.5 million mobile apps, while the Apple App Store has around 1.6 million apps available for iOS. As we crunch the numbers, the facts clearly show that you need a data-driven approach and powerful strategies to drive more app installs to make your app stand out.
You need mobile analytics to track user behavior and demographics. From here, you will have access to a wealth of insights on how to improve app performance and identify bugs and crashes that may be interrupting user experience.
Different types of mobile and web analytics will give you comprehensive data on how your mobile apps perform.
In the next section, you’ll learn more about mobile analytics important facets and why building a successful app goes beyond having beautiful app designs.
What are the types of mobile analytics you should monitor?
A growth strategy without metrics is like chasing the wind. In post-launch, you need to dive deeper into these analytics. After all, you’re running a business.
Here are the mobile analytics you should keep track of.
1. Mobile advertising: track your paid advertisements
Mobile advertising analytics refers to the data collected from paid advertisements for your mobile app. It measures the performance and effectiveness of your campaigns across communication channels.
This data includes metrics such as:
📣 Impression
This is the number of times digital media or ads are displayed on a user’s screen.
Imagine putting a yard sale flyer on a community bulletin board. Every time someone walks by and looks at the flyer, that’s like an “impression” in the digital world. It’s the number of times your yard sale ad is seen by people passing by.
📣 Clicks
They represent the total number of times a user interacts with a link or button on a website or mobile app.
Now, let’s say you also put your phone number on the flyer so people can call you for more details. If someone takes their phone out and dials your number after looking at the flyer, that’s similar to a “click” on the internet. It’s when someone sees your ad and takes action by interacting with it, like calling you.
📣 Conversion
This happens when a user interacts with an ad or product listing and performs a valuable action, like making an online purchase from a mobile device.
Following the example above, imagine that after calling you, a person decides to come to your yard sale and buy something. In digital terms, this is a “conversion”. It’s when someone goes from just looking at your ad to actually doing something valuable, like making a purchase or, in your case, buying an item from your yard sale.
Now, you might be wondering how mobile advertising analytics work if you’re using different communication channels.
The answer is simple. By tracking each ad within your app using a unique identifier like an advertising ID.
This identifier allows you to monitor the performance of each ad. If you discover what works and otherwise, you know which ads to keep running and which to stop.
4 noteworthy mobile advertising apps and tools to explore
Brands use different mobile analytics platforms and tools for this type of analytics. But the few most established ones that have caught the eye of our product strategists are:
✔️1. Google AdMob
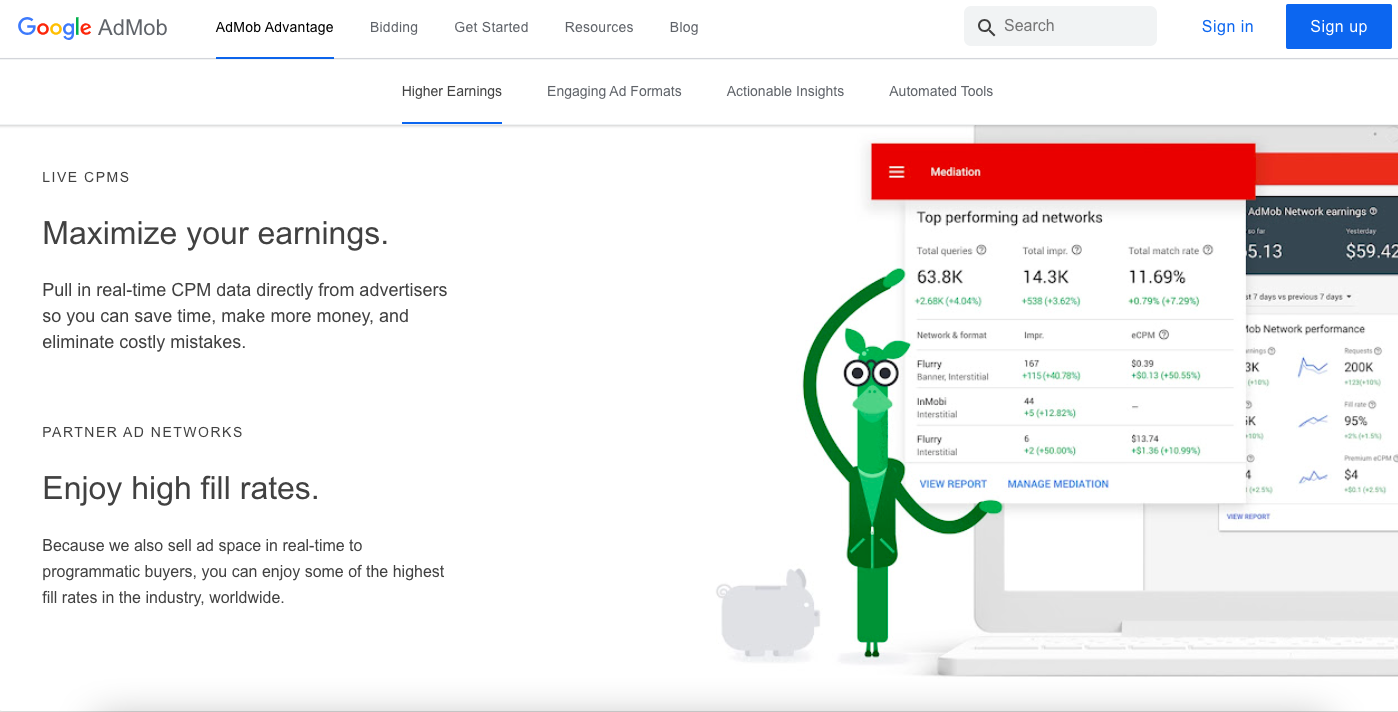
Source: Google
AdMob is a mobile app monetization platform providing high-quality ads to help developers boost their revenue. Ads are matched to apps based on the developer’s criteria and are created and paid for by advertisers.
With AdMob, developers across 200+ countries can monetize their Android and iOS apps by featuring in-app ads.
✔️ 2. Apple Search Ads
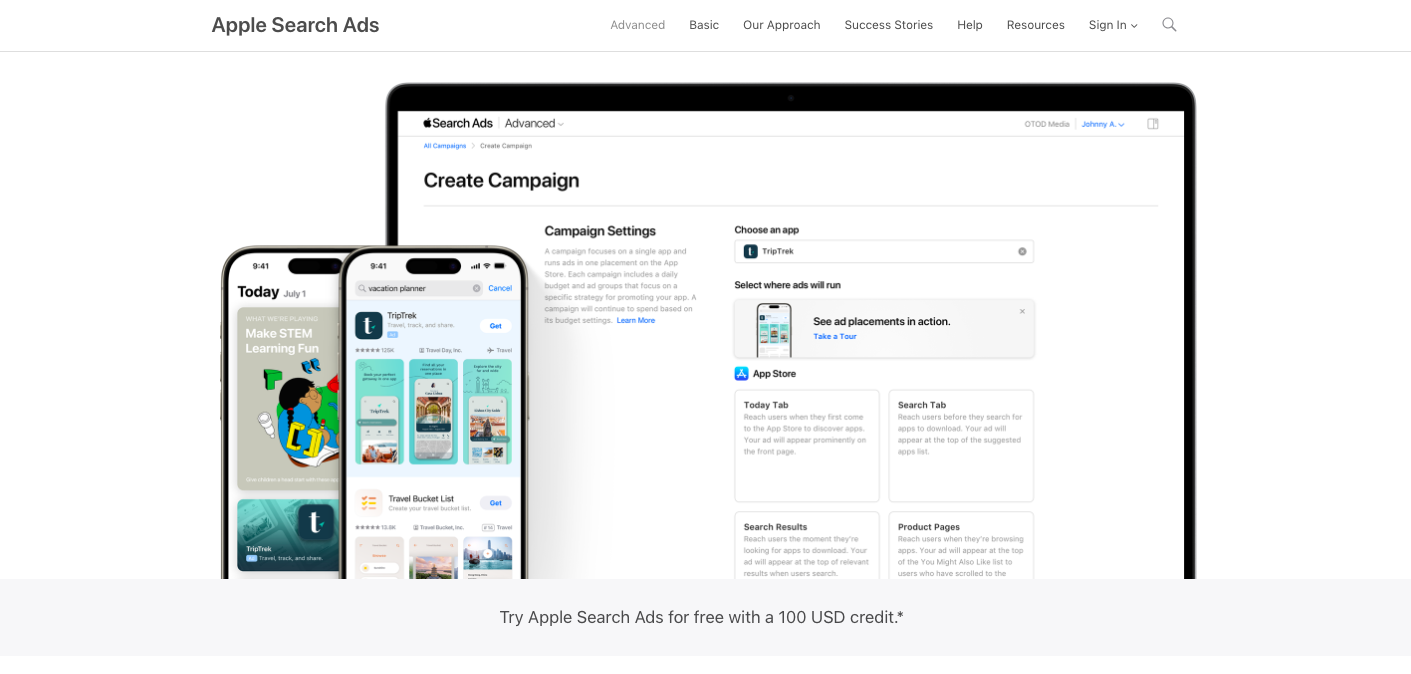
Source: Apple
Apple Search Ads is an advertising platform designed by Apple to help developers promote their apps within the App Store. This platform enables app marketers to increase their app’s visibility and downloads by showing ads to users at critical moments during their search and discovery process in the App Store.
There are two main versions of Apple Search Ads: Basic and Advanced, each catering to different levels of marketing expertise and campaign management preferences.
✔️ 3. Yahoo! Gemini
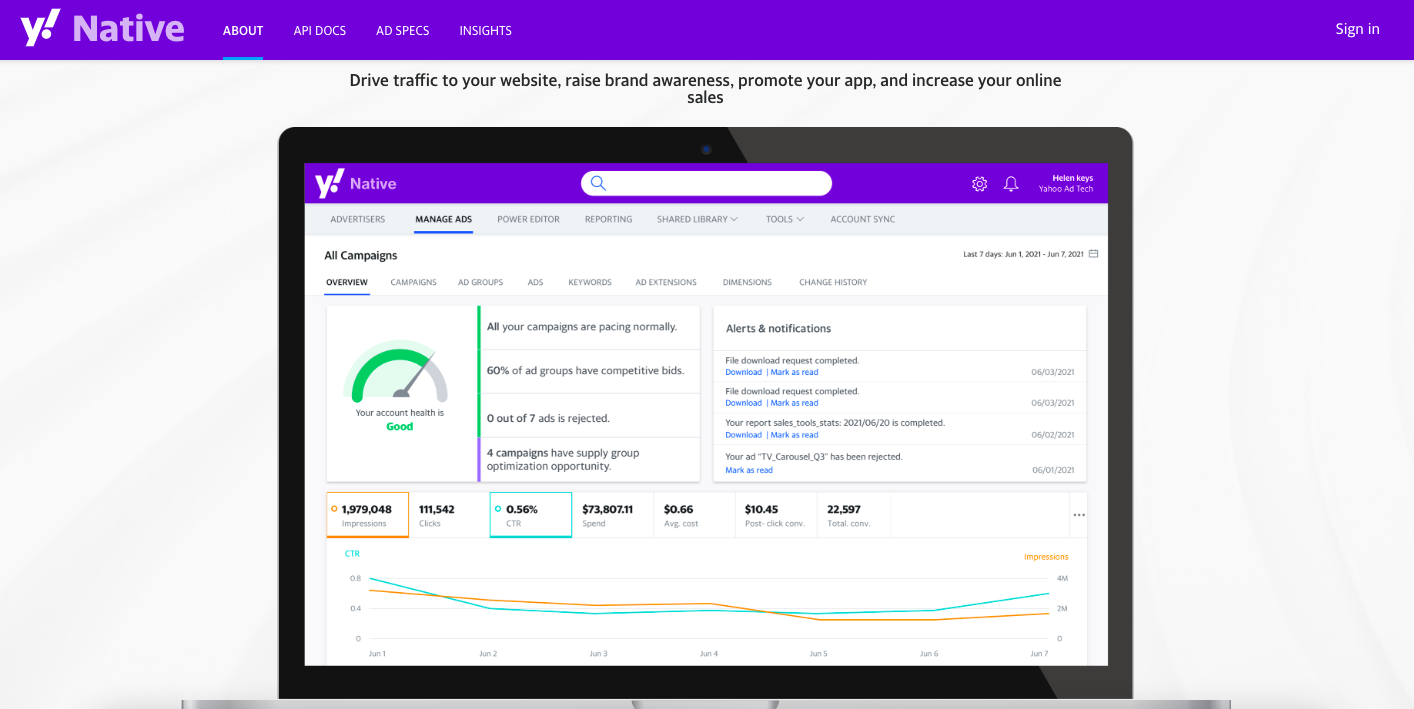
Source: Yahoo!
Yahoo Gemini is a native and mobile ad marketplace that connects publishers and advertisers for optimized native advertising.
Since its launch in 2014, Gemini has become the default audience option in Yahoo’s Ad Manager, alongside a simplified mobile analytics tool to buy and manage native ad products. Yahoo has planned to migrate all accounts by April 30, 2023.
✔️ 4. Meta Facebook Analytics for Apps

Source: Meta
Meta Facebook Analytics for Apps allows you to target your audience based on demographics, age, location, and other factors. This platform is beneficial for promoting your mobile app across Facebook’s vast user base. You can install the free Facebook SDK to start setting up your account.
It offers features like user acquisition and retention, with the ability to track user interactions through an adjust tracker link. I’ll elaborate on these two later. This link connects all user activity to the initial click, providing insights into how specific user types engage with your marketing campaign.
These are just a few of the examples available for your paid ads. To help you decide which one fits your needs, you may also read the reviews of other users using these tools.
- Google AdMob Reviews
- Apple Search Ads Reviews
- Yahoo Native Reviews
- Meta Facebook Analytics for Apps Reviews
2. App monetization analytics: monitor user behavior and interaction
App monetization analytics refers to the data and insights that help brands profit from their apps.
This type of mobile analytics works by tracking user behavior within an app that indicates a willingness to spend money, such as making in-app purchases or viewing ads.
The basic mobile analytics and metrics related to app monetization include the following:
📣 Revenue per user or ARPU
ARPU is the average revenue per user for an app. It measures the average revenue each active user generates, including in-app advertising and purchases. It’s calculated by dividing total app revenue by active users.
Let’s simplify this with a lemonade business. So, you have a lemonade stand in your neighborhood. For a month, you track how many people buy your lemonade and how much money you make. At the end of the month, you want to figure out how much money, on average, each customer brought in.
So, if you made $100 and had 50 customers, each customer, on average, brought in $2 — this average amount is like the ARPU for your lemonade stand. It helps you understand how much each customer is worth to your business.
📣 Cost-per-install
CPI is a metric in mobile app user acquisition campaigns that measures the cost of a new user who installs an app after clicking on an ad. Its formula is total ad spend divided by total installs.
Going back to our lemonade business. Let’s say you decide to advertise your lemonade stand by handing out flyers. You spend $10 on printing these flyers, and, as a result, ten new customers come to buy your lemonade because they saw the flyer.
The cost of getting each new customer (cost-per-install in the digital world) is $1 ($10 spent / 10 new customers). This tells you how much you spend to attract each new customer to your stand.
📣 In-app purchase conversion rates
In-app purchase conversion rate is the percentage of users who buy something in a free app or mobile game. You can calculate it by dividing total downloads by unique impressions.
Imagine that out of everyone who visits your lemonade stand, some see a sign that offers a special deal: a cookie with their lemonade for an extra 50 cents.
In this scenario, the “in-app purchase conversion rate” would be the percentage of your customers who decide to take the deal and buy the cookie.
So, if 100 people buy lemonade and 2 of them also buy a cookie, your conversion rate for this special deal is 2%. This rate helps you understand how effective your special offer is at convincing customers to spend more.
Having access to these data enables you to identify areas for improvement in your native mobile apps’ monetization strategy, such as:
- Tweaking the pricing of in-app purchases or
- Adjusting the frequency of ads displayed
3 highly rated app monetization on G2 tools to explore
Of course, you can’t do all the objectives mentioned without the right mobile app analytics tools on hand. Based on my research, these are the popular and highly rated ones on G2.com.
✔️1. Unity Ads
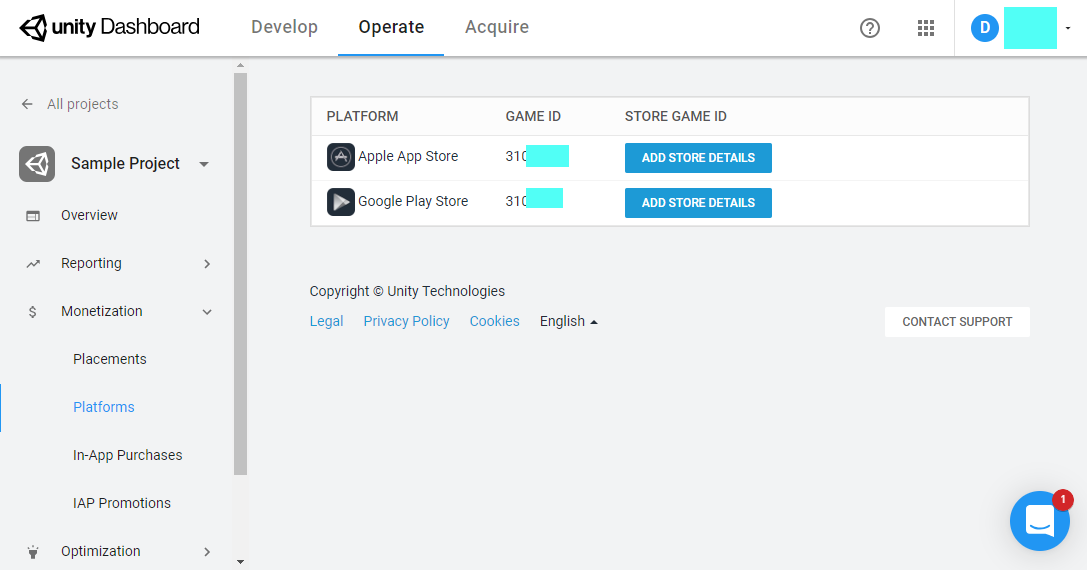
Source: Easymobile
Unity Ads is an all-in-one mobile game ad network and mobile analytics platform. It lets app developers monetize their player base easily, using video interstitials and rewarded video ads.
✔️ 2. Storyly
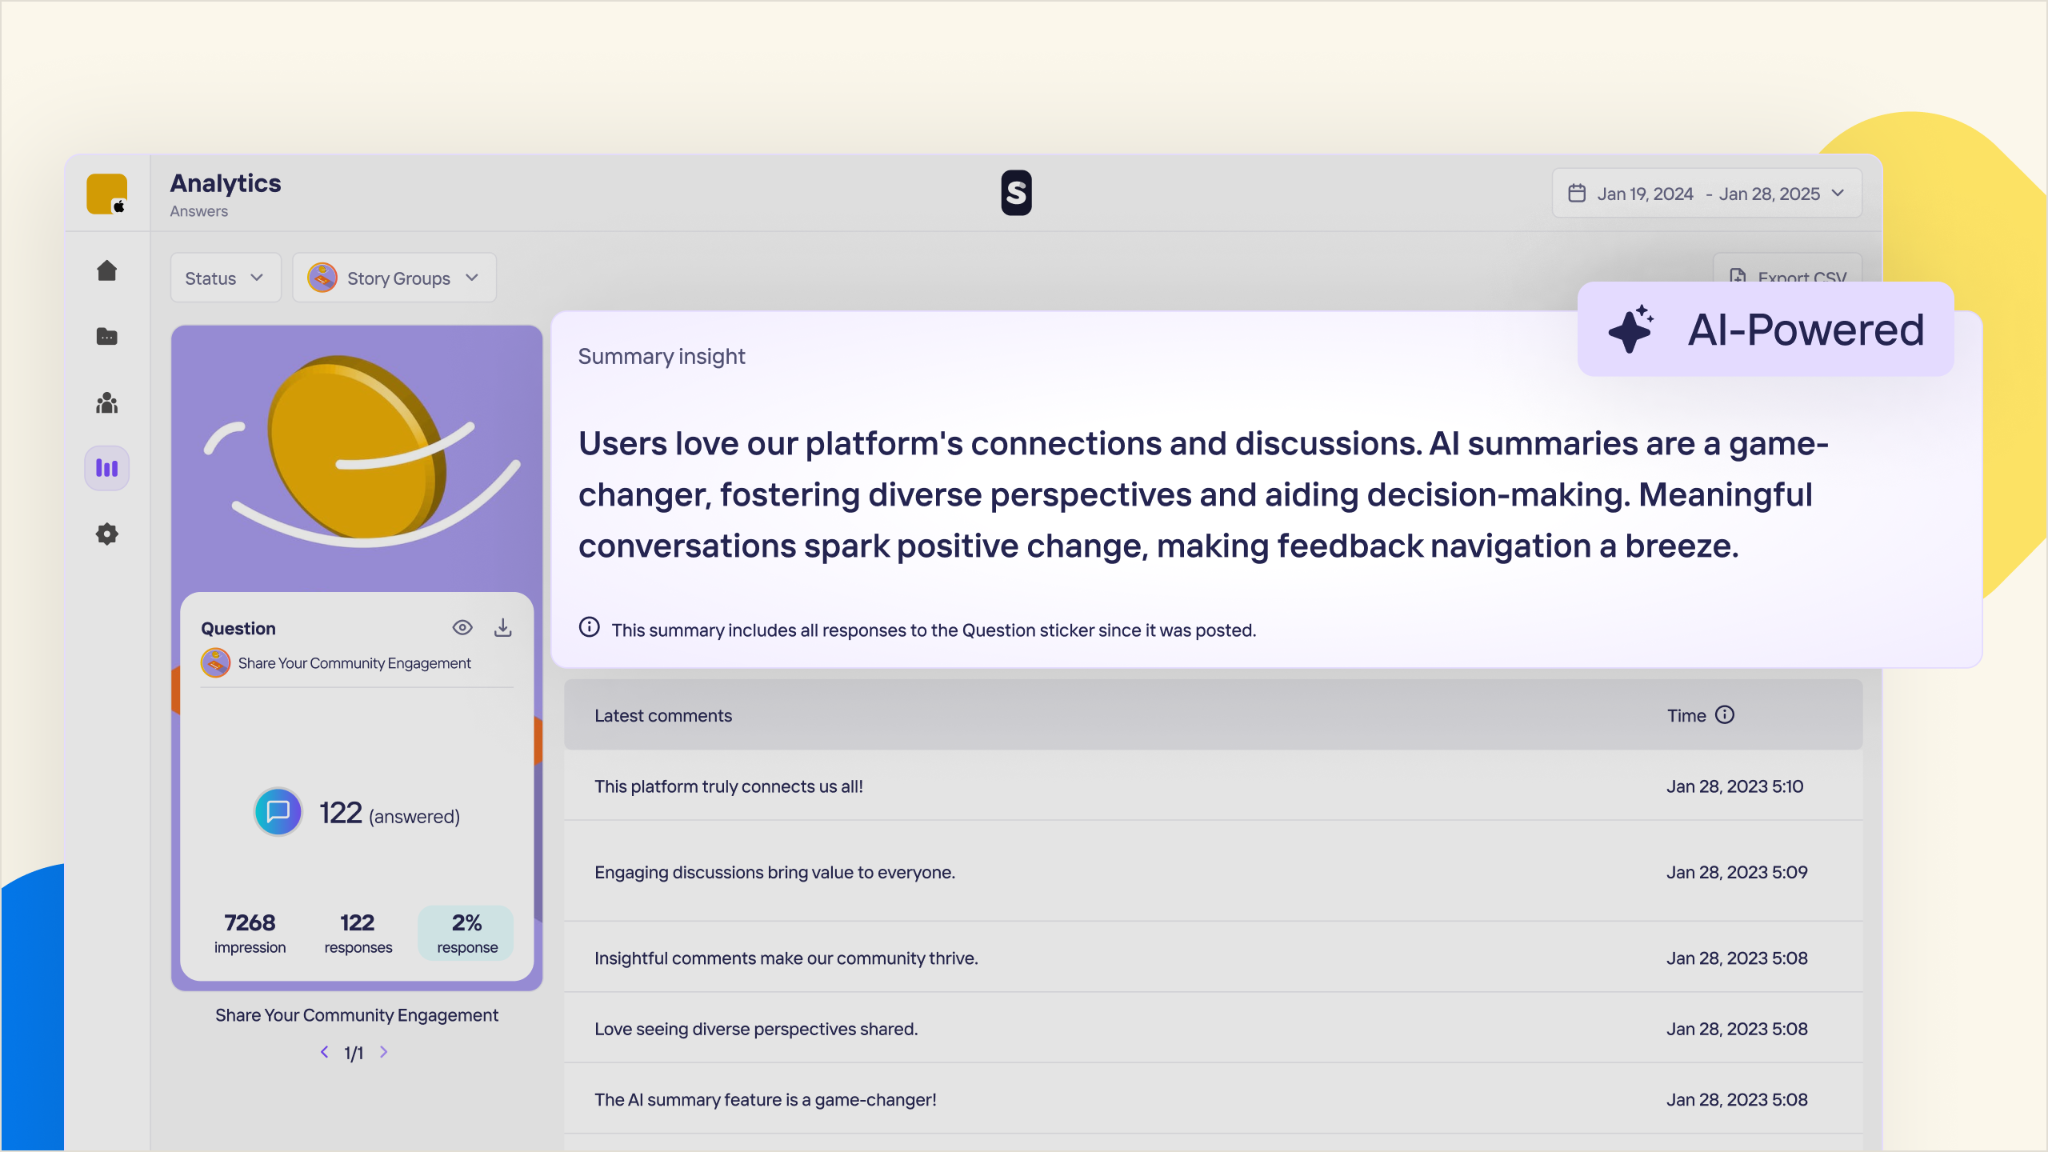
Source: Storyly
Storyly is a user engagement platform that lets developers embed interactive stories in mobile apps and websites.
Its key features include personalized and interactive video content, in-story checkout, shoppable videos, and instant story creation and sharing.
Video marketing is so effective that even small businesses can use videos to attract more app users and increase growth.
✔️ 3. Appodeal
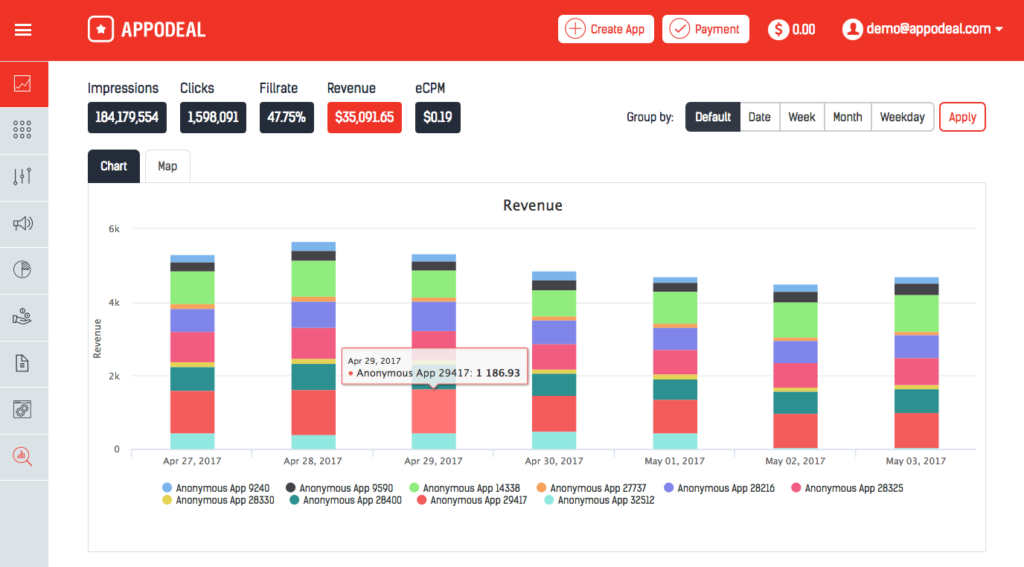
Source: Appodeal
Appodeal helps app developers launch and scale their mobile businesses by providing a Software Development Kit (SDK) that offers access to over 70 ad demand sources competing in real-time auctions to increase ad revenues.
They also offer SDK 3.0, which provides essential tools and features to improve app performance.
3. App engagement: Understand how users interact with your app
App engagement measures how app users interact with mobile applications. Metrics include app opens, session duration, and in-app actions.
Let’s unpack these three briefly:
📣 App opens
Open refers to the number of times a mobile application is launched or brought to the foreground on a user’s device. This metric is important because it indicates how frequently users are returning to the app, which can be a sign of the app’s value to its users.
In email campaigns, an open is counted each time an email is opened. In the context of mobile apps, each time a user tries to access the app, it counts as an app open.
📣 Session duration
This is the amount of time a user spends actively engaged with an app during a single session.
A session typically starts when the app is opened and ends when the app is closed or sent to the background or after a period of inactivity (usually around 30 minutes).
This metric helps developers understand how long users stay engaged with the app’s content or features during a single visit. It’s a key indicator of user engagement and can provide insights into the app’s usability and the quality of the user experience.
📣 In-app actions
In-app or app actions refer to any specific actions that users take while they are using the app. These can include a wide range of activities such as making a purchase, completing a level in a game, posting a comment, or any other interactive element within the app that can be tracked.
Tracking in-app actions helps you understand which are the most frequently used features – how they’re being used and what factors of your app drive users to navigate them. You can also identify areas of improvement or expansion within the app.
Analyzing user behavior lets you understand how much they spend more time on the app. It gives you more data and touchpoints to capitalize on.
🔖 One example of an app crushing its in-app engagement well is Candy Crush.

Source: Candy Crush
When they analyzed user behavior, the developers could identify that users were not engaging with certain game levels and were dropping off at an alarming rate. They also engaged with players directly via Facebook about new levels and how the users were doing with the game.
They used this data to redesign these levels, significantly increasing user engagement and app retention.
Mobile analytics tools to track app engagement
There are a few good mobile analytics tools that help you dive deeper from basic to comprehensive insights.
Here are some mobile analytics platforms that have earned excellent reviews on G2 – these can help you dip your toes in data once your mobile app gains traction.
1. AppsFlyer
AppsFlyer is a mobile attribution and marketing analytics platform that helps marketers measure and optimize their entire mobile customer journey from discovery through acquisition, retention, and monetization.
This tool provides detailed campaign analytics, attribution data, and tools for deep linking, fraud prevention, and more.
2. Mixpanel
Mixpanel offers advanced analytics for mobile and web applications, focusing on user interaction and engagement. It allows developers and marketers to track how users engage with their apps, including what actions they take and how often they return.
It has event tracking, funnel analysis, and retention reports to understand user behavior while using your mobile app.
3. Smartlook
Smartlook provides qualitative analytics for websites and mobile apps, offering insights into user behavior through session recordings, heatmaps, and event tracking.
This tool helps app publishers identify usability issues to improve user experience. Aside from the numerical data it offers to your table, you can use the session recordings to understand why users drop off immediately or stay longer in a specific feature or function.
Once you get a bigger picture of how users engage with your app, you also want to know how it’s performing in the marketplace, which will be discussed in the next section.
4. App store analytics: Determine how your app performs on app stores
App store analytics refers to the data and insights gathered from app stores such as Apple’s App Store or Google Play.
This analytics type provides an in-depth analysis of how your app is performing in the marketplace alongside your competition.
App store analytics collects your app’s downloads, ratings, reviews, and user engagement. This information is then evaluated by various mobile analytics solutions and metrics to help you optimize your app’s performance in the app stores.
A concrete example of how an app can use app store analytics is by analyzing the app’s ratings and reviews. Developers can make the necessary changes to improve their app’s functionality by seeing common complaints or praise from users.
This analysis not only leads to a better user experience but can also result in increased downloads and higher app store rankings.
🔖 Take Grill’d, for instance, whose app reviews were initially bombarded by negative comments from its users.
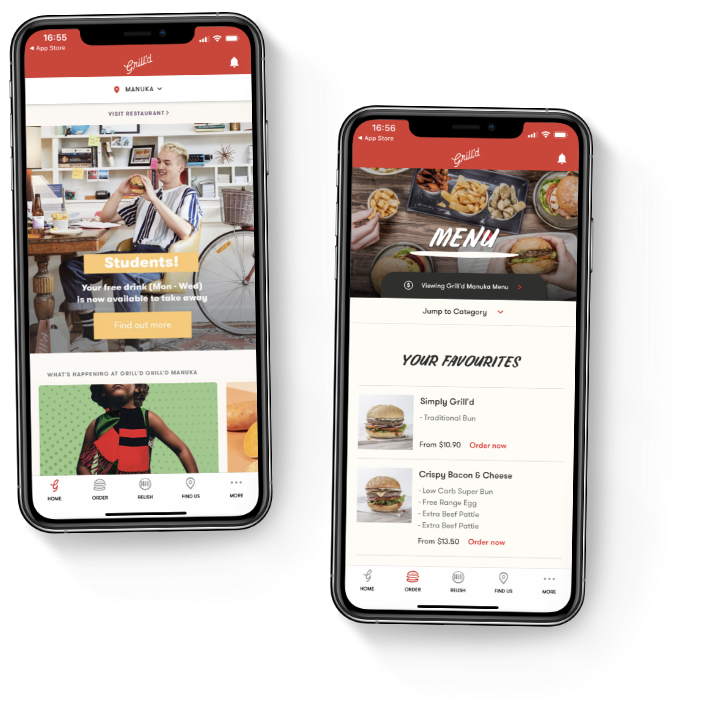
Grill’d had a faulty app with multiple software issues that previous developers couldn’t solve. When Appetiser came into the picture, our team worked hard and fixed it.
The result?
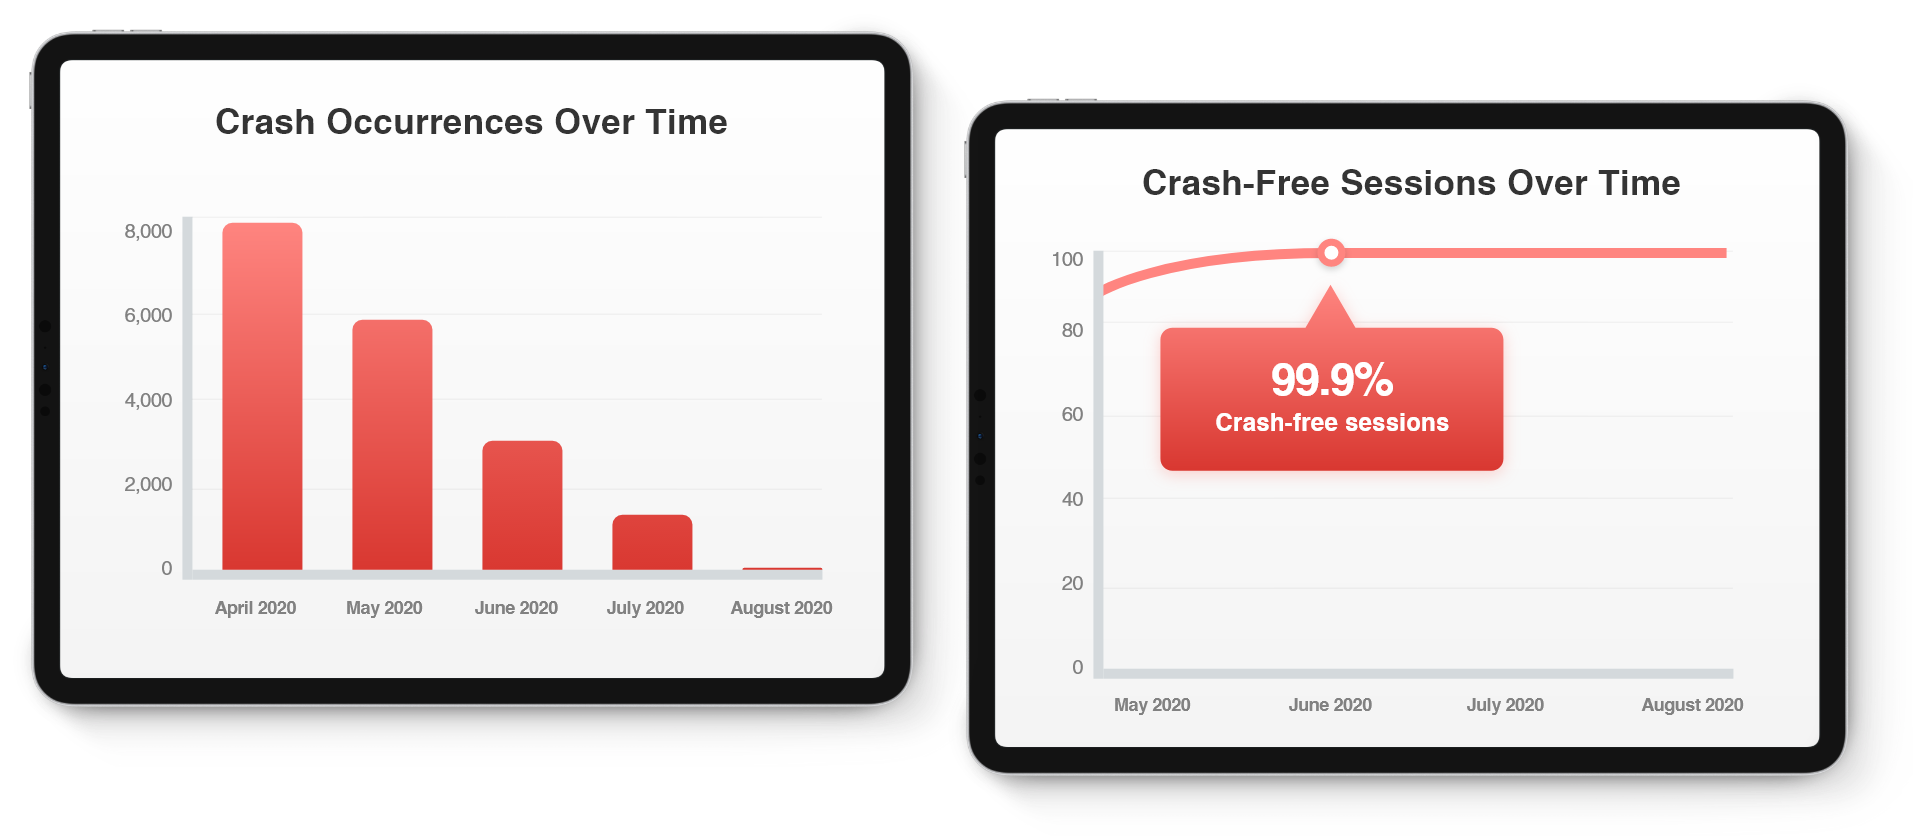
Today, the app has a 99.8% crash-free rate and smooth online ordering. It has also boosted order numbers by 10 times, and reduced load times by 83%.
5. Performance analytics: Monitor performance across different channels
Performance analytics focuses on measuring and optimizing user acquisition and engagement. This type of mobile analytics helps marketers gather, measure, and analyze various touch points to improve the performance of their apps based on data insights.
Performance analytics equip you to:
- Understand your app’s number of users, demographics, and where they come from.
- Measure what actions your daily active users are taking, whether they just want to use free features or are interested in making in-app purchases for an upgraded experience.
- Customize reports specific to your business that your marketing and sales team can use to improve their strategies.
- Visualize user navigation paths to understand how users move through a mobile application and interact with its content. This can identify areas for improvement in the user experience and optimize UI/UX.
- Slice and dice your mobile analytics data to understand different mobile users’ group behavior to gain insights into how different they behave while using the app and tailor your marketing strategies accordingly.
Though performance analytics have the said benefits, let me present a real-life use case to help you better appreciate their importance.
And there’s no better example than Youfoodz, Australia’s leading fresh food delivery app that succeeded in tailoring its marketing strategies.
🔖 Youfoodz partnered with a marketing firm to unlock customer data, gain insights, segment customers, and drive effective marketing to boost repurchasing.
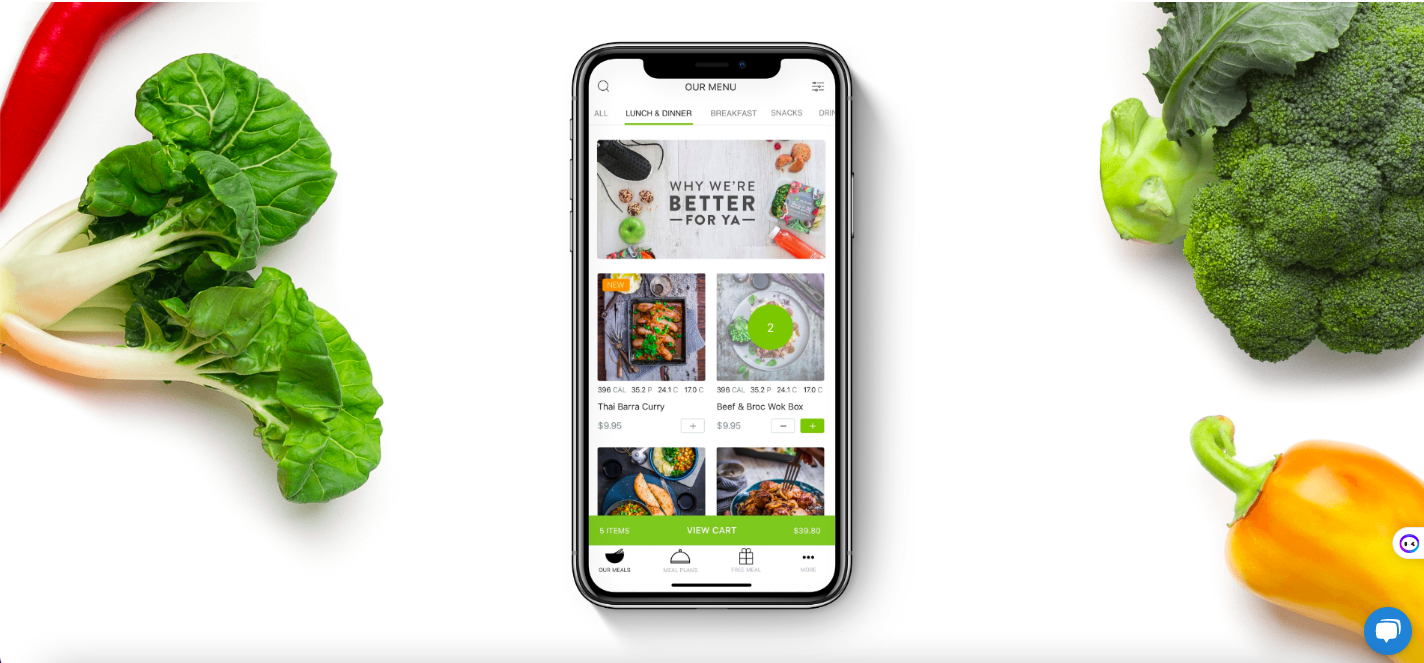
By leveraging Shopify and Customer.AI integration, they obtained a unified customer view for valuable insights, efficient stock inventory, and optimization of targeted ad audiences through Facebook campaigns.
That’s the power of leveraging data through mobile analytics.
Now, let’s first have a recap of the types of mobile analytics you should monitor as an app publisher:
- Mobile advertising analytics for your paid campaigns and marketing efforts
- App monetization analytics for generating profits
- App engagement analytics to understand user’s behavior while your app
- App store analytics to see how well your mobile app is ranking on app stores
- Performance analytics for overall app performance across channels
In the next section, you’ll need to delve deeper into KPIs: these are the nitty gritty aspects of analytics. But they do contribute to how you can make your users stay in your ecosystem.
How to analyze mobile app user behavior: KPIs to track on mobile analytics
When it comes to monitoring mobile app performance, tracking key performance indicators, or KPIs, should become part of your routine.
This will allow you to stay on top of your app’s success and adjust your approach as needed in every user journey.
Here are some key metrics that mobile apps often need attention to.
- Retention rate: It measures the percentage of users who return to your app after their first visit.
- Churn rate: It measures the percentage of users who stop using your app over a given period of time.
- Monthly active users (MAUs): This is the number of unique users who engage with your app in a given month.
- Session length: This measures how long users engage with it in one go or a single session.
- App session intervals: This measures the usage frequency of the app.
- Engagement metrics: These include metrics such as screen views, time spent on the app, and number of sessions per user.
- Crash rate: This measures the percentage of times your app crashes or experiences errors.
- Load time: This measures how long it takes for your app to load.
- User feedback: This includes metrics such as ratings, reviews, and surveys that provide insight into user satisfaction and preferences.
- Social media engagement: This measures how often users share content from your app on social media platforms.
- Geolocation metrics: These include metrics such as location-based engagement and user demographics.
- Push notification metrics: These include metrics such as open rates, click-through rates, and opt-out rates for push notifications.
- Heatmaps and user session recreation: It offers a visual representation of how users explore your app’s features. By recreating user sessions, you can see precisely where they tap and how they move from screen to screen.
Remember, not all KPIs will be relevant to every mobile app, so determine which are most valuable or necessary for your funnel analysis and business goals.
To further help you keep the momentum in staying on top of the data, let me walk you through some steps.
What are the steps for mobile app analytics?
The road to app success isn’t a walk in the park. You need a robust strategy to take you to the next level you envisioned.
When you launch an app, the work doesn’t stop – this is where the most exciting part comes in. Users actually interact with your app. The following is your guide for further reach.
1. Define goals and key performance indicators (KPIs)
Before diving into analytics, clearly define what success looks like for your app. This involves setting specific, measurable goals and identifying the KPIs that will help you track progress towards these goals.
Common KPIs include user acquisition rates, retention rates, session lengths, and conversion rates.
2. Choose the right mobile analytics tools
Select an analytics platform that aligns with your goals and provides the metrics you need. Start with the types of mobile analytics to focus on, and for each type, choose the one that you think can cover all the metrics you need.
Consider factors like pricing, features, ease of integration, and the level of support provided.
3. Implement tracking
Integrate the analytics SDK into your app to start collecting data. This step varies depending on the platform and may require updating your app’s code.
For iOS apps, you may need to enable install tracking in your analytics account and update your app to use the latest SDK. For Android apps, install tracking is typically enabled automatically. Check with your mobile analytics tool in setting up the SDK.
4. Set up custom campaigns
Custom campaigns help you track the effectiveness of marketing efforts by adding parameters to your app’s download URL.
These parameters enable you to identify which campaigns drive app installs and user engagement. Use tools provided by your analytics platform to create these URLs.
5. Collect and analyze data
Once tracking is in place, start collecting data on user interactions within your app. Analyze this data to understand user behavior, identify trends, and pinpoint areas for improvement of your app.
Look at metrics like acquisition sources, user engagement, app retention, and conversion rates.
6. Test and optimize
Use the insights gained from your analytics to test different aspects of your app. This could involve A/B testing different features, optimizing your onboarding process, or tweaking your marketing campaigns.
The goal is to continuously improve user experience and engagement based on data provided by your analytics tools.
7. Monitor performance over time
Mobile app analytics is not a one-time task but an ongoing process. Regularly monitor your app’s performance, keeping an eye on your KPIs and adjusting your strategies as needed.
This will help you stay aligned with your goals and adapt to changes in user behavior or market conditions.
But if you think you need a growth partner to go beyond the extra mile, you can speak with our product growth strategists on how you can take advantage of Appetiser Hypercare ™ for post-launch support and strategies.
What’s the difference between mobile app analytics and mobile web analytics?
Mobile app analytics and mobile web analytics are distinct in several ways, primarily due to the different environments and user behaviors associated with each platform.
| Mobile app analytics | Mobile web analytics | |
|---|---|---|
| Tracking and analysis focus | Active users, retention rate, feature usage, engagement metrics, and monetization (ARPU, ARPPU, MRR) and access hardware features like cameras, motion sensors, and GPS | Page views, unique visitors, bounce rate, time on site, and conversion rate. Focus on lead generation, landing page views, and overall website traffic |
| Data collection methods | Use software development kits (SDKs) to track data | Use JavaScript-based page tagging and cookies |
| User behavior and interactions | Complex analysis of user interactions and app usage | May only focus on web visits and immediate actions like conversions |
Tracking and analysis focus
- Mobile app analytics: Focuses on user-level events and interactions within the app. It tracks active users, retention rate, feature usage, engagement metrics, and monetization (ARPU, ARPPU, MRR). Mobile app analytics can also access hardware features like cameras, motion sensors, and GPS, providing a deeper understanding of user interactions in mobile devices.
- Mobile web analytics: Concentrates on traffic and page-level metrics like page views, unique visitors, bounce rate, time on site, and conversion rate. It concerns the lead generation, landing page views, and overall website traffic. Web analytics tools use JavaScript-based tracking codes and rely on cookies to identify unique users.
Data collection methods
- Mobile app analytics: Use software development kits (SDKs) tailored to specific operating systems (iOS, Android) to track data. These SDKs allow for measuring app-specific dimensions and metrics, such as screen views and sessions, which are analogous to page views and visits in web analytics.
- Mobile web analytics: Primarily relies on JavaScript-based page tagging for data collection. This method is suitable for tracking user behavior on mobile or desktop browsers as the users visit websites.
User behavior and interaction
- Mobile app analytics: Measures more complex user interactions not typically seen on mobile websites. This includes tracking how users engage with various app features and interact with the app’s hardware integrations. The goal is to retain app users and lock them for the long-term.
- Mobile web analytics: Often deals with one-time website visits and focuses more on immediate actions like conversions. It may not capture the depth of user engagement that mobile app analytics can, as web interactions are generally less complex.
Though web interactions are generally less complicated than the ones for mobile apps, the increase in mobile phones has prompted many website developers to adapt their growth strategies. For more information, check out our article on improving mobile user conversion rates.
Numbers tell it all: success is possible with optimization
Overall, mobile app analytics are essential for any business wishing to measure growth strategies for app success.
Investing in a mobile analytics platform is worthwhile for analyzing different performance metrics and devising targeted strategies to reach peak engagement and revenue.
Analyzing user behavior data and precisely identifying user profiles are key sources of valuable data that inform decisions in feature development, expansion opportunities, product maintenance, and user experience.
Of course, making those informed decisions requires a substantial understanding of mobile apps’ complexities.
If you prioritize successful app performance but lack internal resources, partnering with a reliable app development partner is your best bet.
At Appetiser we have one mission — transform entrepreneurs and industries to push the boundaries of what an app development partner can be on both a local and global level.
In other words, we make it easier for you to overcome the challenges you might encounter when building an app.
Need help in developing and optimizing your mobile app? Reach out to us today — and let’s discuss how we can add value to your app business journey.

Maria Krisette Lim is a Content Marketing Specialist with 14 years of experience producing web and print ad content. Krisette has a BSBA degree, major in Business Management and Entrepreneurship. When she’s not tinkering with words and punctuation, she’s either curled up with a book while sipping hot tea, playing with her toddler, or tinkering with website builders.